Compute index values for a tour history.
path_index(history, index_f, data = attr(history, "data"))Arguments
- history
list of bases produced by
save_history(or otherwise)- index_f
index function to apply to each basis
- data
dataset to be projected on to bases
See also
save_history for options to save history
Examples
fl_holes <- save_history(flea[, 1:6], guided_tour(holes()), sphere = TRUE)
#> Converting input data to the required matrix format.
#> Target: 0.824, 6.8% better
#> Target: 0.870, 5.5% better
#> Target: 0.874, 0.5% better
#> Target: 0.875, 0.1% better
#> Target: 0.877, 0.2% better
#> Target: 0.889, 1.3% better
#> Target: 0.896, 0.9% better
#> Target: 0.899, 0.3% better
#> Target: 0.900, 0.1% better
#> Target: 0.902, 0.3% better
#> Target: 0.907, 0.5% better
#> Target: 0.908, 0.1% better
#> Target: 0.911, 0.3% better
#> Target: 0.912, 0.1% better
#> Target: 0.914, 0.2% better
#> Target: 0.915, 0.1% better
#> Target: 0.917, 0.2% better
#> No better bases found after 25 tries. Giving up.
#> Final projection:
#> 0.867 0.210
#> 0.041 -0.678
#> -0.244 -0.364
#> -0.058 0.208
#> 0.379 -0.559
#> 0.199 -0.096
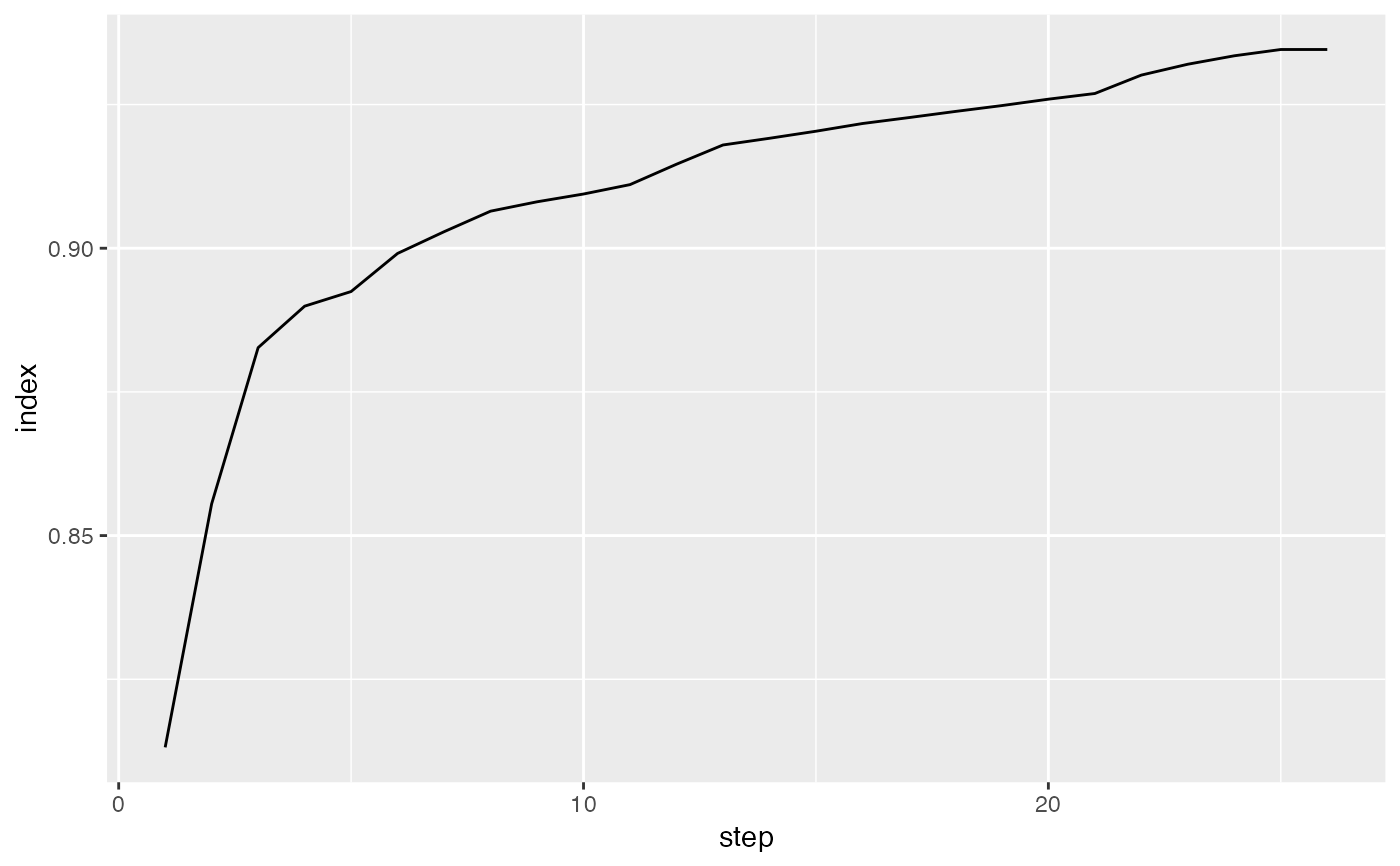
path_index(fl_holes, holes())
#> [1] 0.7718028 0.8241241 0.8696834 0.8738917 0.8749664 0.8768158 0.8885089
#> [8] 0.8963419 0.8991606 0.9002331 0.9024905 0.9072314 0.9084838 0.9110375
#> [15] 0.9120128 0.9139628 0.9151325 0.9165359 0.9165359
#> attr(,"class")
#> [1] "path_index"
## path_index(fl_holes, cmass())
plot(path_index(fl_holes, holes()), type = "l")
 ## plot(path_index(fl_holes, cmass()), type = "l")
# \donttest{
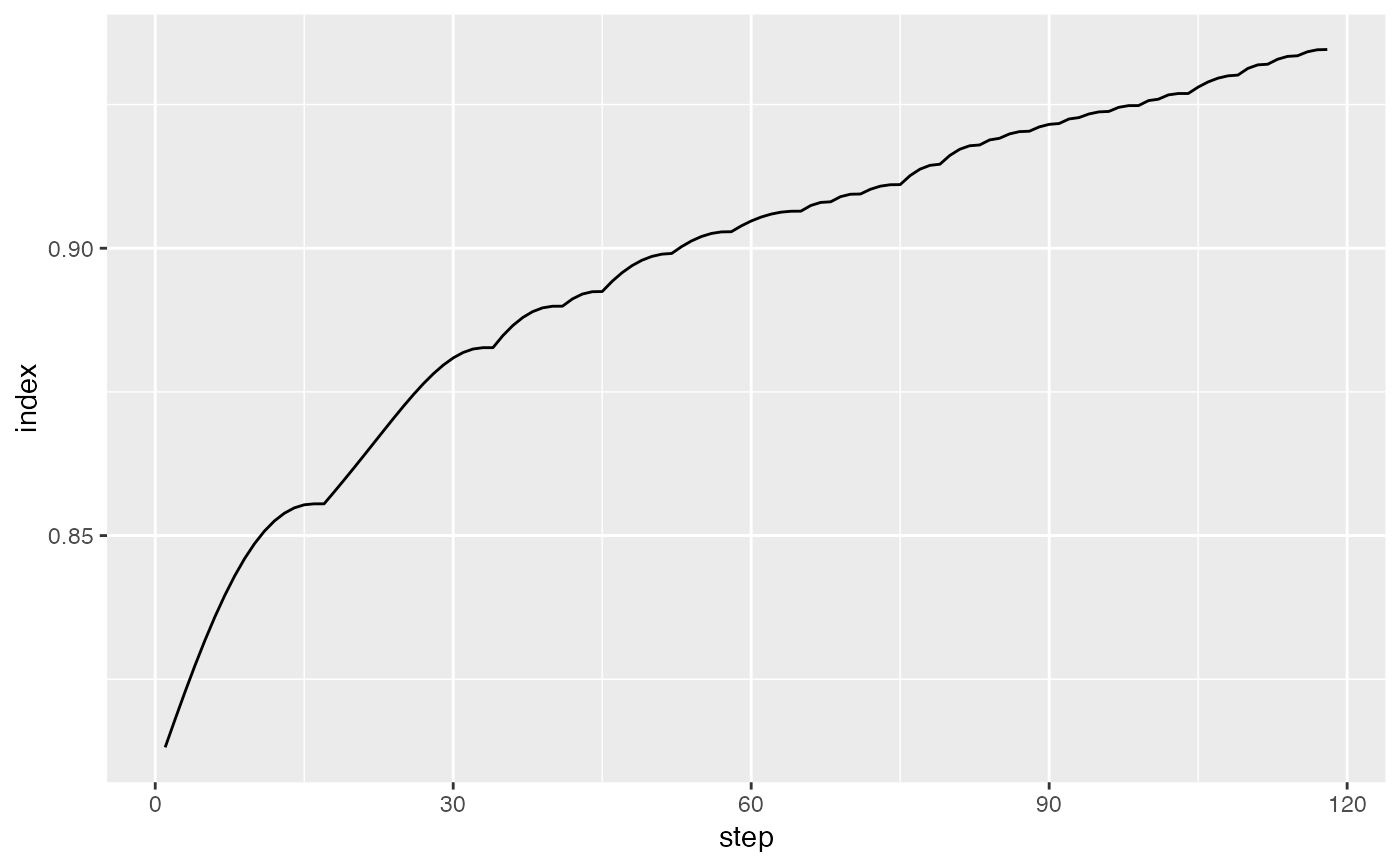
# Use interpolate to show all intermediate bases as well
hi <- path_index(interpolate(fl_holes), holes())
hi
#> [1] 0.7718028 0.7736411 0.7755610 0.7775607 0.7796396 0.7817981 0.7840370
#> [8] 0.7863569 0.7887582 0.7912403 0.7938010 0.7964364 0.7991405 0.8019049
#> [15] 0.8047187 0.8075681 0.8104372 0.8133073 0.8161575 0.8189653 0.8217061
#> [22] 0.8241241 0.8271748 0.8304119 0.8337957 0.8372811 0.8408187 0.8443563
#> [29] 0.8478403 0.8512172 0.8544351 0.8574450 0.8602013 0.8626634 0.8647957
#> [36] 0.8665685 0.8679579 0.8689463 0.8695222 0.8696834 0.8710215 0.8721172
#> [43] 0.8729586 0.8735361 0.8738415 0.8738917 0.8745881 0.8749285 0.8749664
#> [50] 0.8758649 0.8764719 0.8767778 0.8768158 0.8780418 0.8792224 0.8803630
#> [57] 0.8814650 0.8825261 0.8835403 0.8844985 0.8853886 0.8861969 0.8869081
#> [64] 0.8875067 0.8879776 0.8883067 0.8884819 0.8885089 0.8905100 0.8922759
#> [71] 0.8937671 0.8949471 0.8957835 0.8962490 0.8963419 0.8975876 0.8984676
#> [78] 0.8989876 0.8991605 0.8991606 0.8998961 0.9002175 0.9002331 0.9015032
#> [85] 0.9022542 0.9024905 0.9037307 0.9047923 0.9056714 0.9063623 0.9068580
#> [92] 0.9071502 0.9072314 0.9081028 0.9084718 0.9084838 0.9095825 0.9103906
#> [99] 0.9108830 0.9110375 0.9117510 0.9120117 0.9120128 0.9129795 0.9136193
#> [106] 0.9139300 0.9139628 0.9147005 0.9150774 0.9151325 0.9159035 0.9163732
#> [113] 0.9165362 0.9165359
#> attr(,"class")
#> [1] "path_index"
plot(hi)
## plot(path_index(fl_holes, cmass()), type = "l")
# \donttest{
# Use interpolate to show all intermediate bases as well
hi <- path_index(interpolate(fl_holes), holes())
hi
#> [1] 0.7718028 0.7736411 0.7755610 0.7775607 0.7796396 0.7817981 0.7840370
#> [8] 0.7863569 0.7887582 0.7912403 0.7938010 0.7964364 0.7991405 0.8019049
#> [15] 0.8047187 0.8075681 0.8104372 0.8133073 0.8161575 0.8189653 0.8217061
#> [22] 0.8241241 0.8271748 0.8304119 0.8337957 0.8372811 0.8408187 0.8443563
#> [29] 0.8478403 0.8512172 0.8544351 0.8574450 0.8602013 0.8626634 0.8647957
#> [36] 0.8665685 0.8679579 0.8689463 0.8695222 0.8696834 0.8710215 0.8721172
#> [43] 0.8729586 0.8735361 0.8738415 0.8738917 0.8745881 0.8749285 0.8749664
#> [50] 0.8758649 0.8764719 0.8767778 0.8768158 0.8780418 0.8792224 0.8803630
#> [57] 0.8814650 0.8825261 0.8835403 0.8844985 0.8853886 0.8861969 0.8869081
#> [64] 0.8875067 0.8879776 0.8883067 0.8884819 0.8885089 0.8905100 0.8922759
#> [71] 0.8937671 0.8949471 0.8957835 0.8962490 0.8963419 0.8975876 0.8984676
#> [78] 0.8989876 0.8991605 0.8991606 0.8998961 0.9002175 0.9002331 0.9015032
#> [85] 0.9022542 0.9024905 0.9037307 0.9047923 0.9056714 0.9063623 0.9068580
#> [92] 0.9071502 0.9072314 0.9081028 0.9084718 0.9084838 0.9095825 0.9103906
#> [99] 0.9108830 0.9110375 0.9117510 0.9120117 0.9120128 0.9129795 0.9136193
#> [106] 0.9139300 0.9139628 0.9147005 0.9150774 0.9151325 0.9159035 0.9163732
#> [113] 0.9165362 0.9165359
#> attr(,"class")
#> [1] "path_index"
plot(hi)
 # }
# }