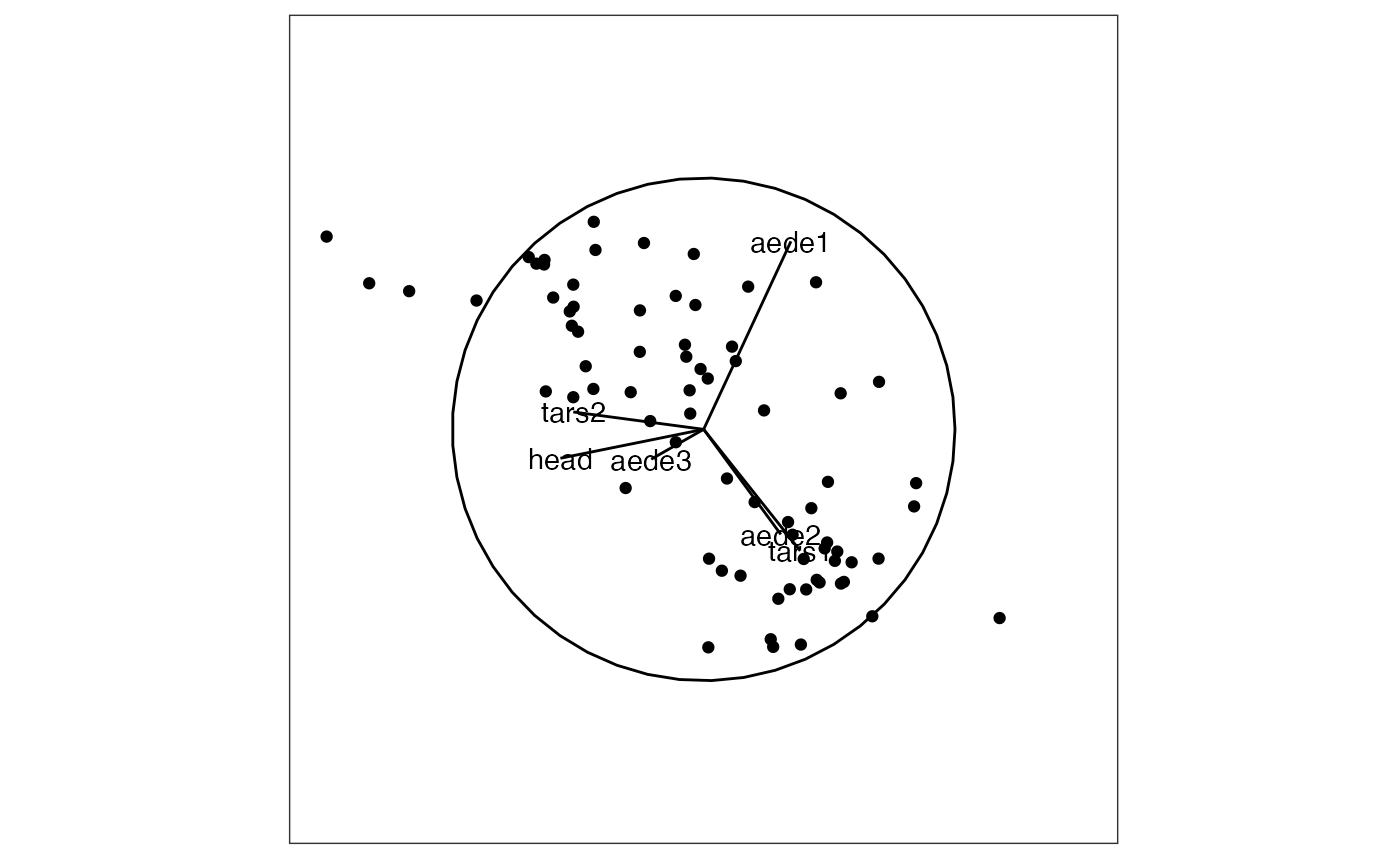
This function takes a projection matrix as produced by save_history(), and draws it on the projected data like a biplot. This will product the data objects needed in order for the user to plot with base or ggplot2. Note that for now this only works for 2D projections.
render_proj(
  data,
  prj,
  axis_labels = NULL,
  obs_labels = NULL,
  limits = 1,
  position = "center"
)
Arguments
- data
matrix, or data frame containing numeric columns, should be standardised to have mean 0, sd 1
- prj
projection matrix
- axis_labels
of the axes to be displayed
- obs_labels
labels of the observations to be available for interactive mouseover
- limits
value setting the lower and upper limits of projected data, default 1
- position
position of the axes: center (default), bottomleft or off
Value
list containing projected data, circle and segments for axes
Examples
data(flea)
flea_std <- apply(flea[,1:6], 2, function(x) (x-mean(x))/sd(x))
prj <- basis_random(ncol(flea[,1:6]), 2)
p <- render_proj(flea_std, prj)
if (require("ggplot2")) {
  ggplot() +
    geom_path(data=p$circle, aes(x=c1, y=c2)) +
    geom_segment(data=p$axes, aes(x=x1, y=y1, xend=x2, yend=y2)) +
    geom_text(data=p$axes, aes(x=x2, y=y2, label=rownames(p$axes))) +
    geom_point(data=p$data_prj, aes(x=P1, y=P2)) +
    xlim(-1,1) + ylim(-1, 1) +
    theme_bw() +
    theme(aspect.ratio=1,
       axis.text=element_blank(),
       axis.title=element_blank(),
       axis.ticks=element_blank(),
       panel.grid=element_blank())
}