Plot column or row percentage using bar plots.
Usage
ggally_colbar(
  data,
  mapping,
  label_format = scales::label_percent(accuracy = 0.1),
  ...,
  remove_background = FALSE,
  remove_percentage_axis = FALSE,
  reverse_fill_levels = FALSE,
  geom_bar_args = NULL
)

ggally_rowbar(
  data,
  mapping,
  label_format = scales::label_percent(accuracy = 0.1),
  ...,
  remove_background = FALSE,
  remove_percentage_axis = FALSE,
  reverse_fill_levels = TRUE,
  geom_bar_args = NULL
)
Arguments
- data
data set using
- mapping
aesthetics being used
- label_format
formatter function for displaying proportions, not taken into account if a label aesthetic is provided in
mapping- ...
other arguments passed to
geom_text(...)- remove_background
should the
panel.backgroundbe removed?- remove_percentage_axis
should percentage axis be removed? Removes the y-axis for
ggally_colbar()and x-axis forggally_rowbar()- reverse_fill_levels
should the levels of the fill variable be reversed?
- geom_bar_args
other arguments passed to
geom_bar(...)
Examples
# Small function to display plots only if it's interactive
p_ <- GGally::print_if_interactive
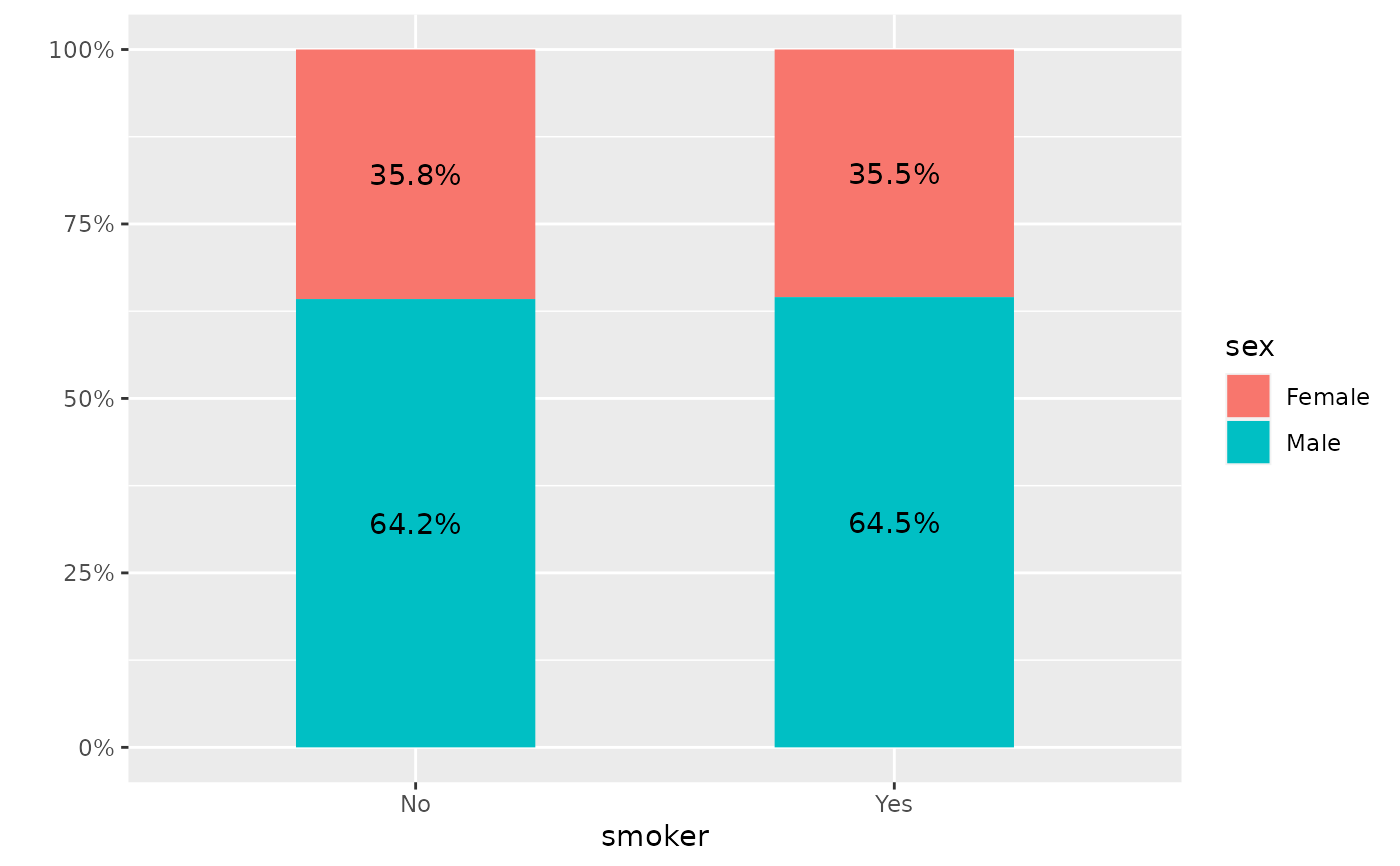
data(tips)
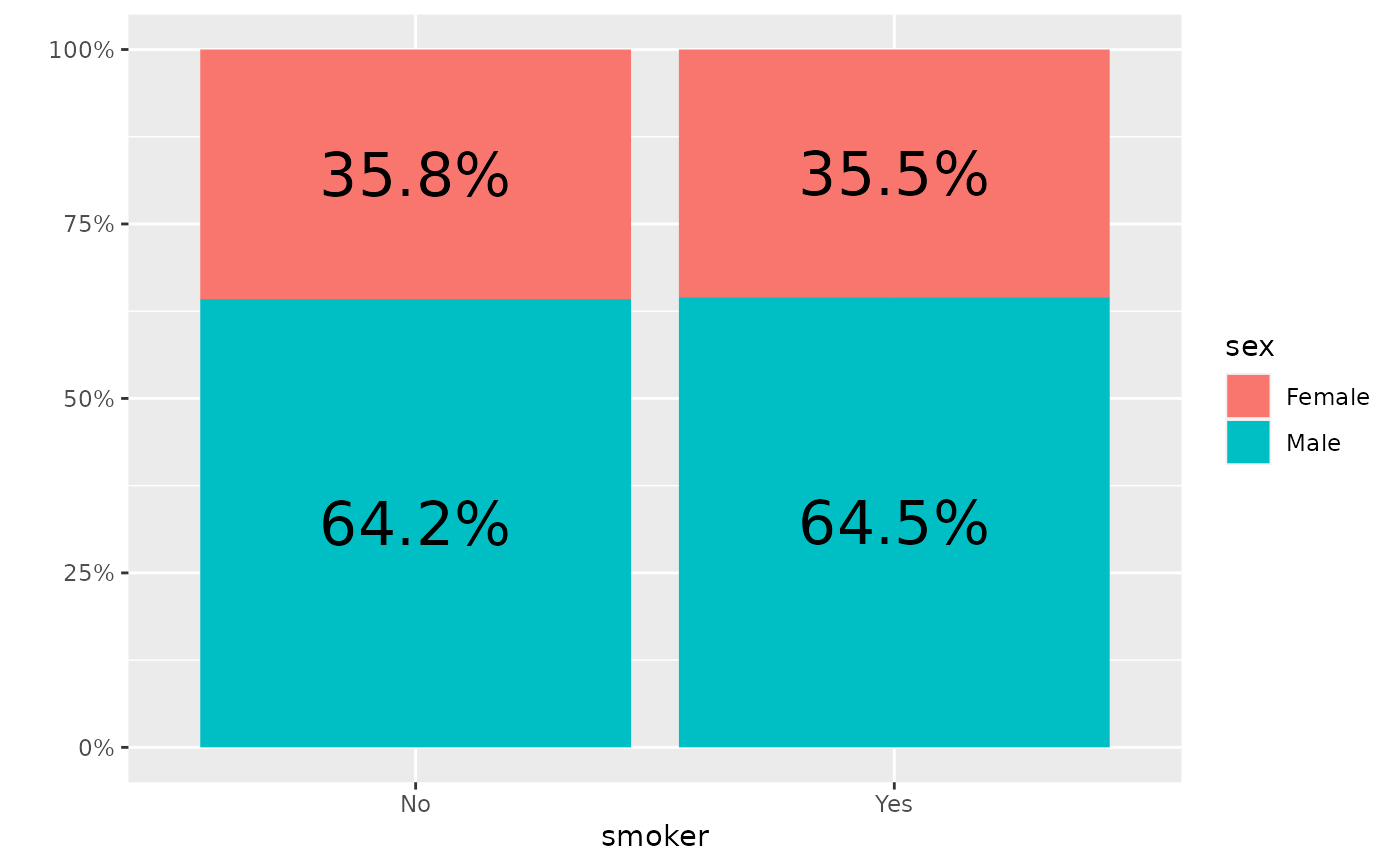
p_(ggally_colbar(tips, mapping = aes(x = smoker, y = sex)))
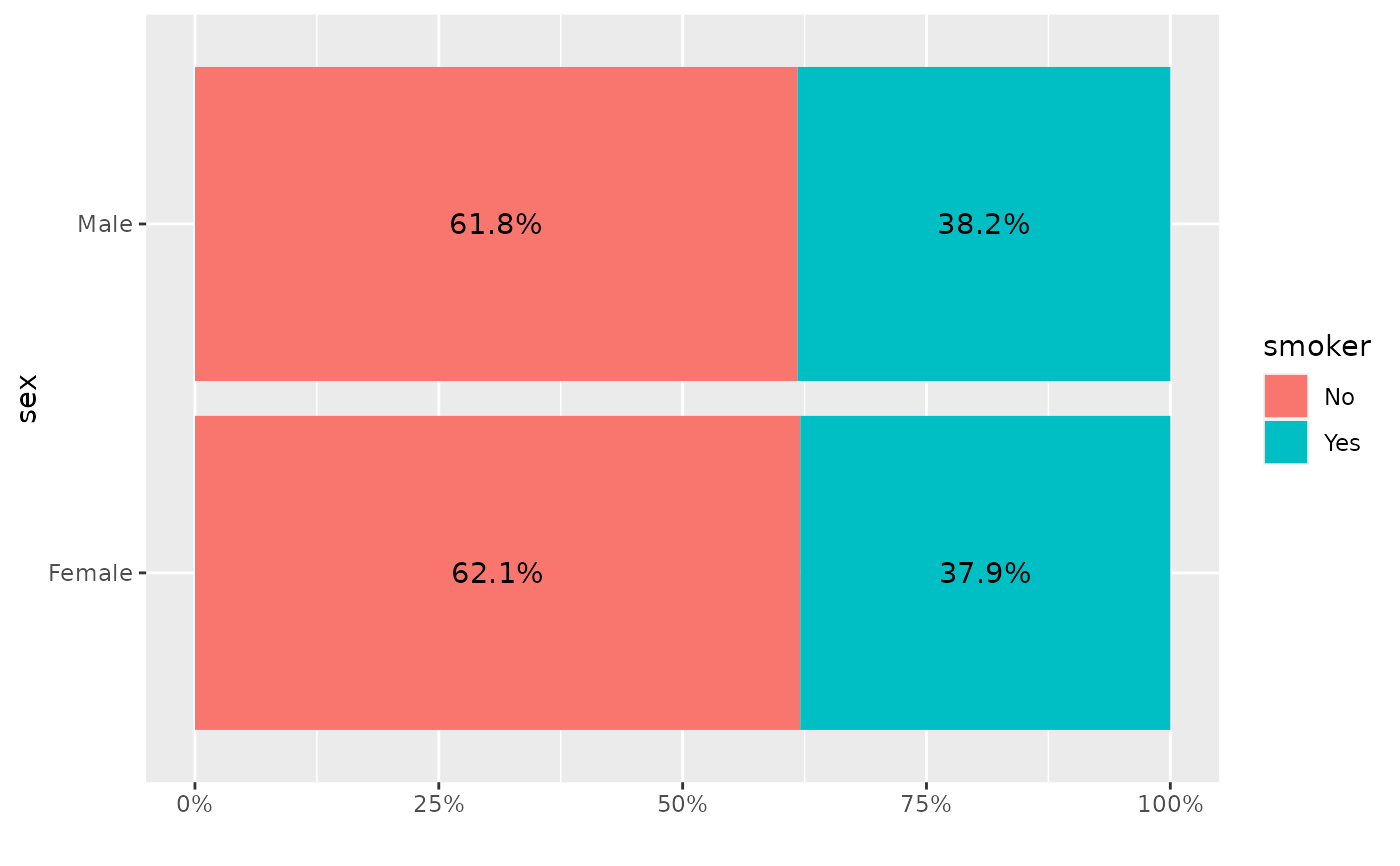
 p_(ggally_rowbar(tips, mapping = aes(x = smoker, y = sex)))
 # change labels' size
p_(ggally_colbar(tips, mapping = aes(x = smoker, y = sex), size = 8))
# change labels' size
p_(ggally_colbar(tips, mapping = aes(x = smoker, y = sex), size = 8))
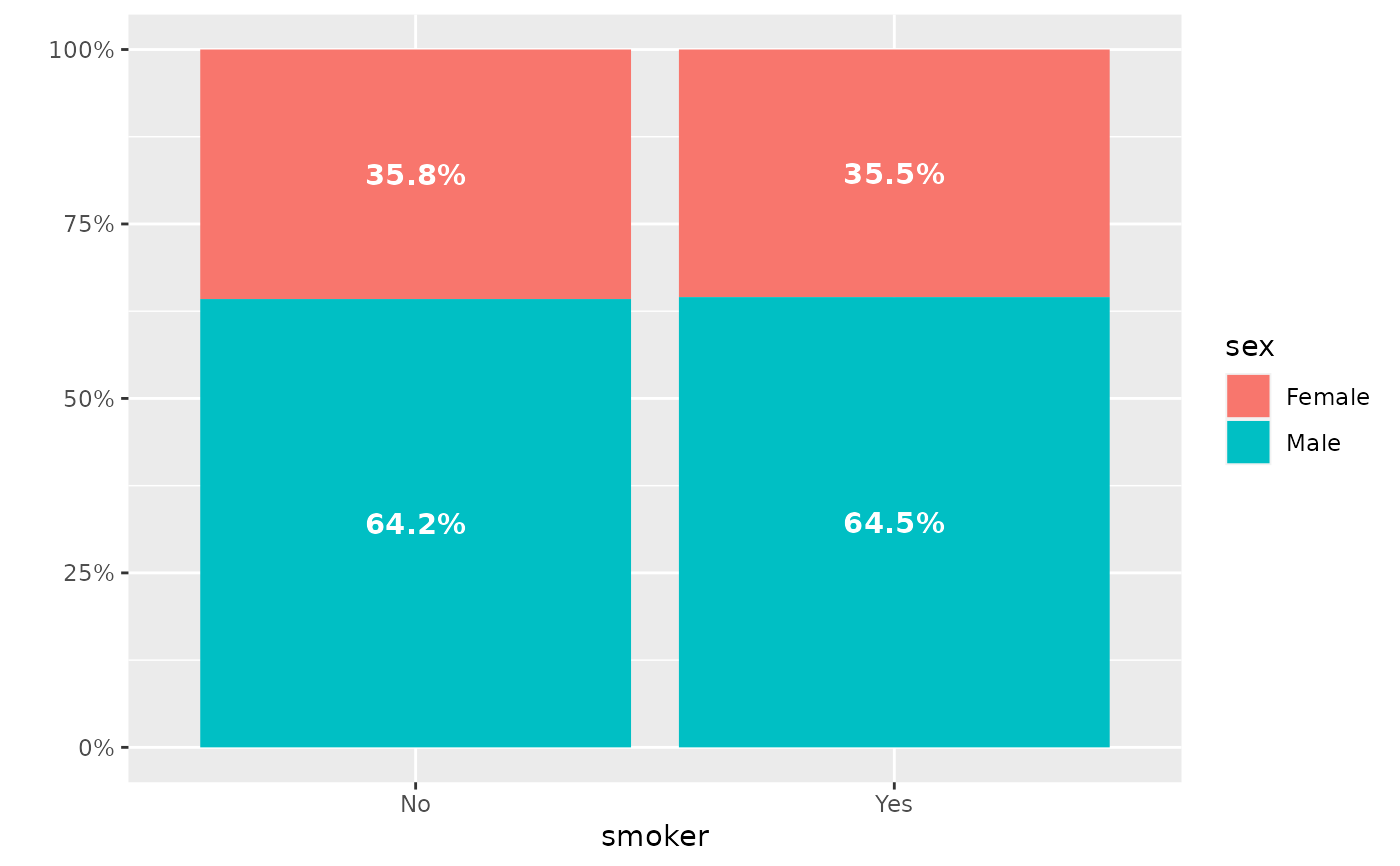
 # change labels' colour and use bold
p_(ggally_colbar(tips,
mapping = aes(x = smoker, y = sex),
colour = "white", fontface = "bold"
))
# change labels' colour and use bold
p_(ggally_colbar(tips,
mapping = aes(x = smoker, y = sex),
colour = "white", fontface = "bold"
))
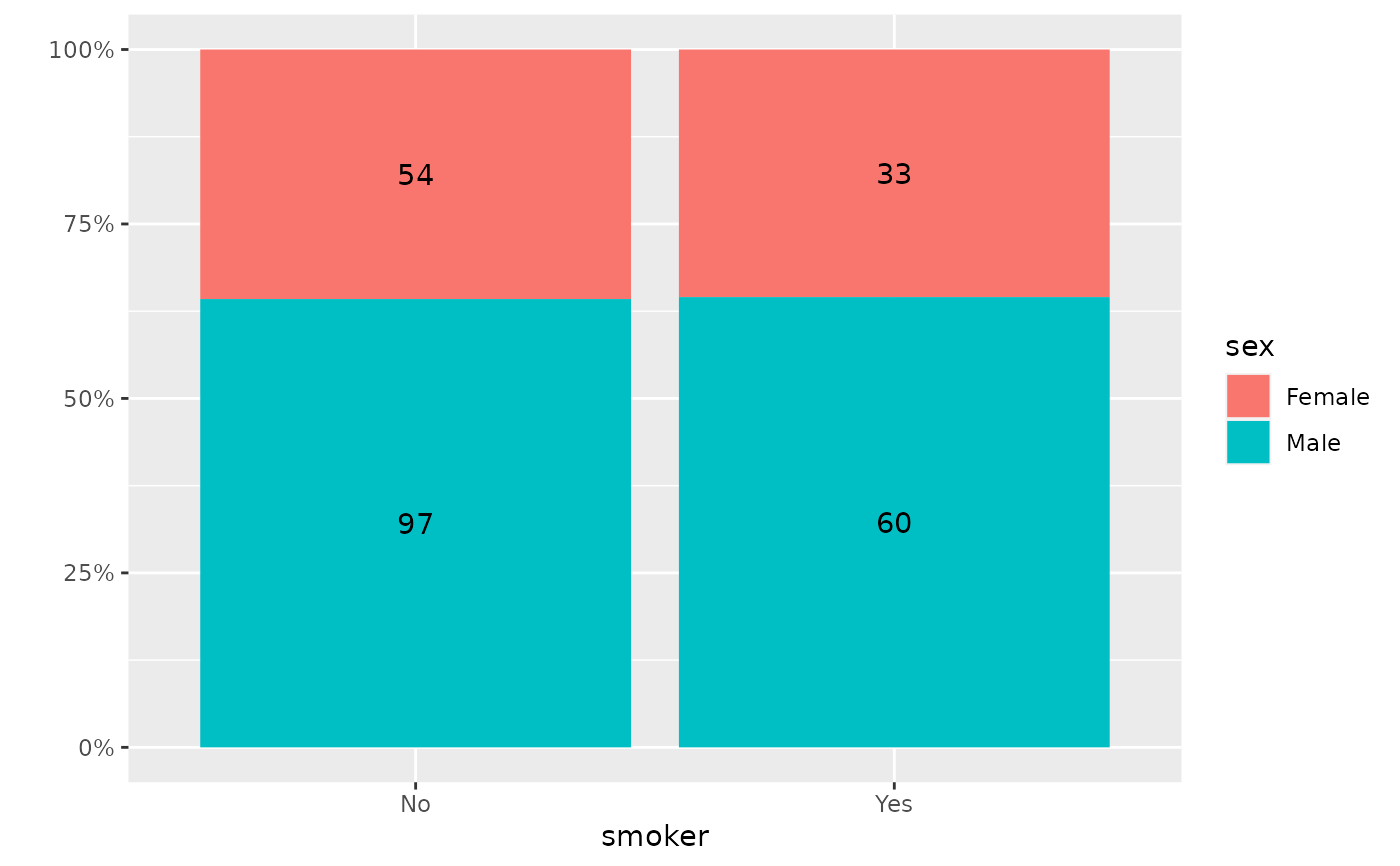
 # display number of observations instead of proportions
p_(ggally_colbar(tips, mapping = aes(x = smoker, y = sex, label = after_stat(count))))
# display number of observations instead of proportions
p_(ggally_colbar(tips, mapping = aes(x = smoker, y = sex, label = after_stat(count))))
 # custom bar width
p_(ggally_colbar(tips, mapping = aes(x = smoker, y = sex), geom_bar_args = list(width = .5)))
# custom bar width
p_(ggally_colbar(tips, mapping = aes(x = smoker, y = sex), geom_bar_args = list(width = .5)))
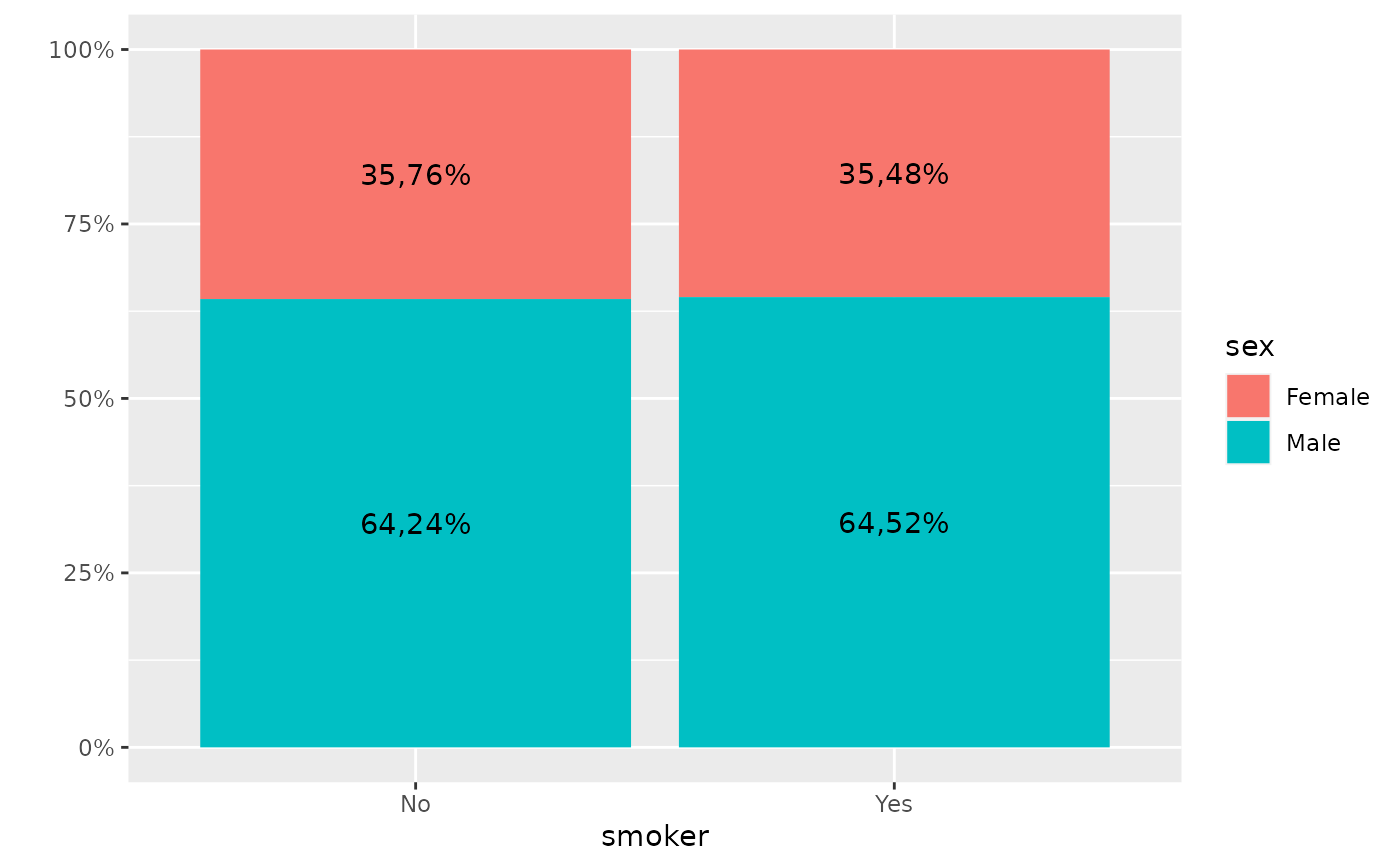
 # change format of labels
p_(ggally_colbar(tips,
mapping = aes(x = smoker, y = sex),
label_format = scales::label_percent(accuracy = .01, decimal.mark = ",")
))
# change format of labels
p_(ggally_colbar(tips,
mapping = aes(x = smoker, y = sex),
label_format = scales::label_percent(accuracy = .01, decimal.mark = ",")
))
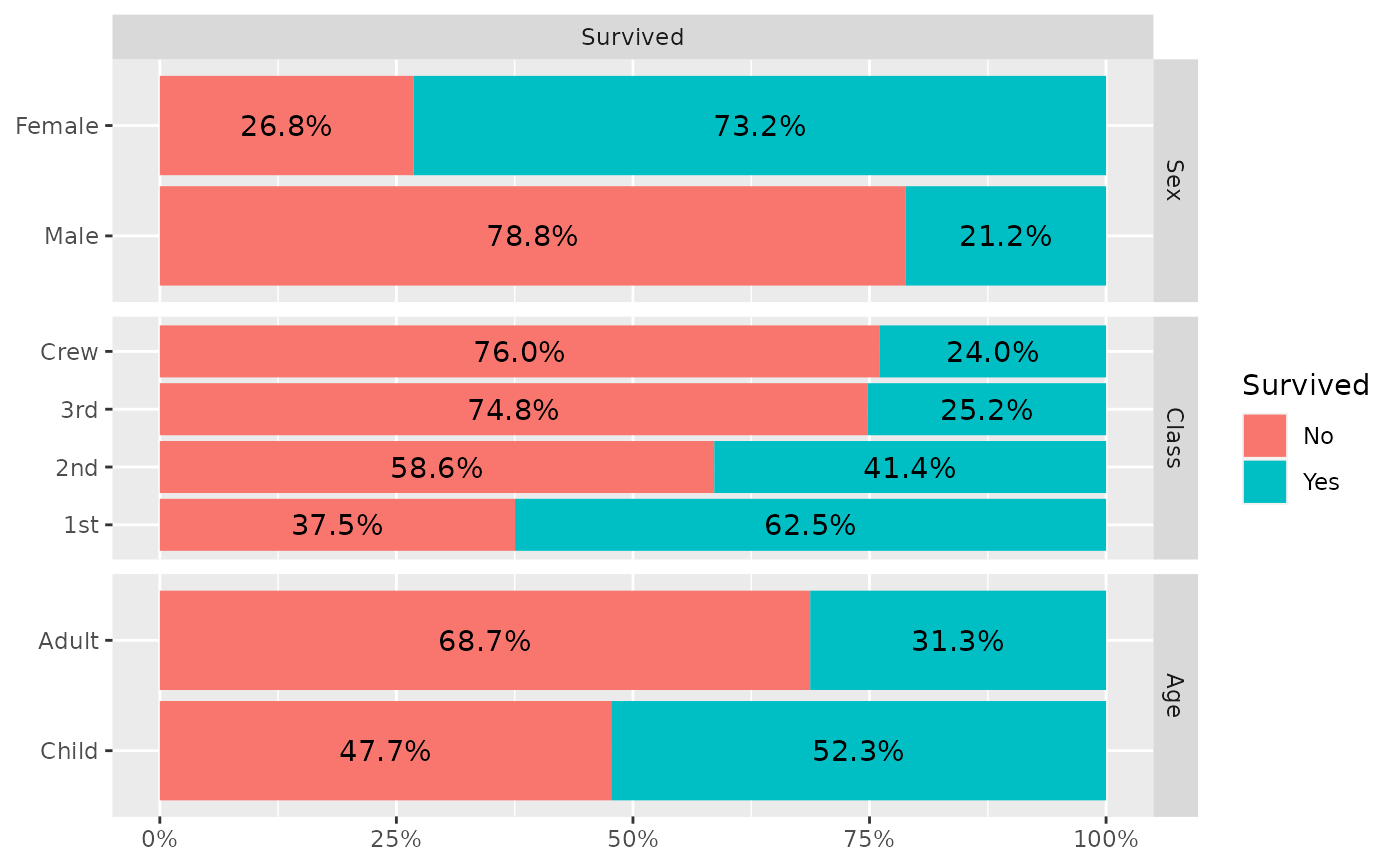
 p_(ggduo(
data = as.data.frame(Titanic),
mapping = aes(weight = Freq),
columnsX = "Survived",
columnsY = c("Sex", "Class", "Age"),
types = list(discrete = "rowbar"),
legend = 1
))
p_(ggduo(
data = as.data.frame(Titanic),
mapping = aes(weight = Freq),
columnsX = "Survived",
columnsY = c("Sex", "Class", "Age"),
types = list(discrete = "rowbar"),
legend = 1
))