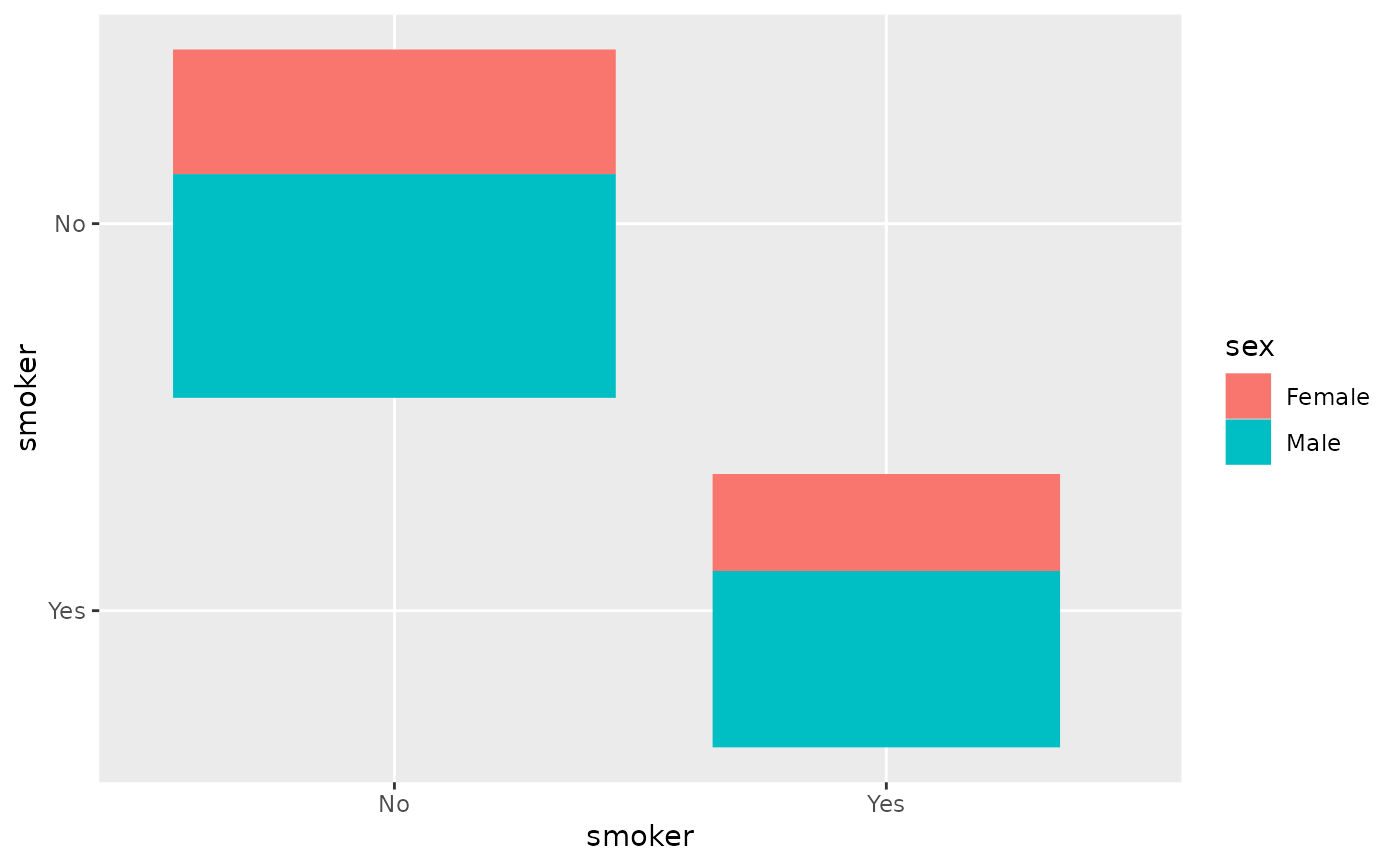
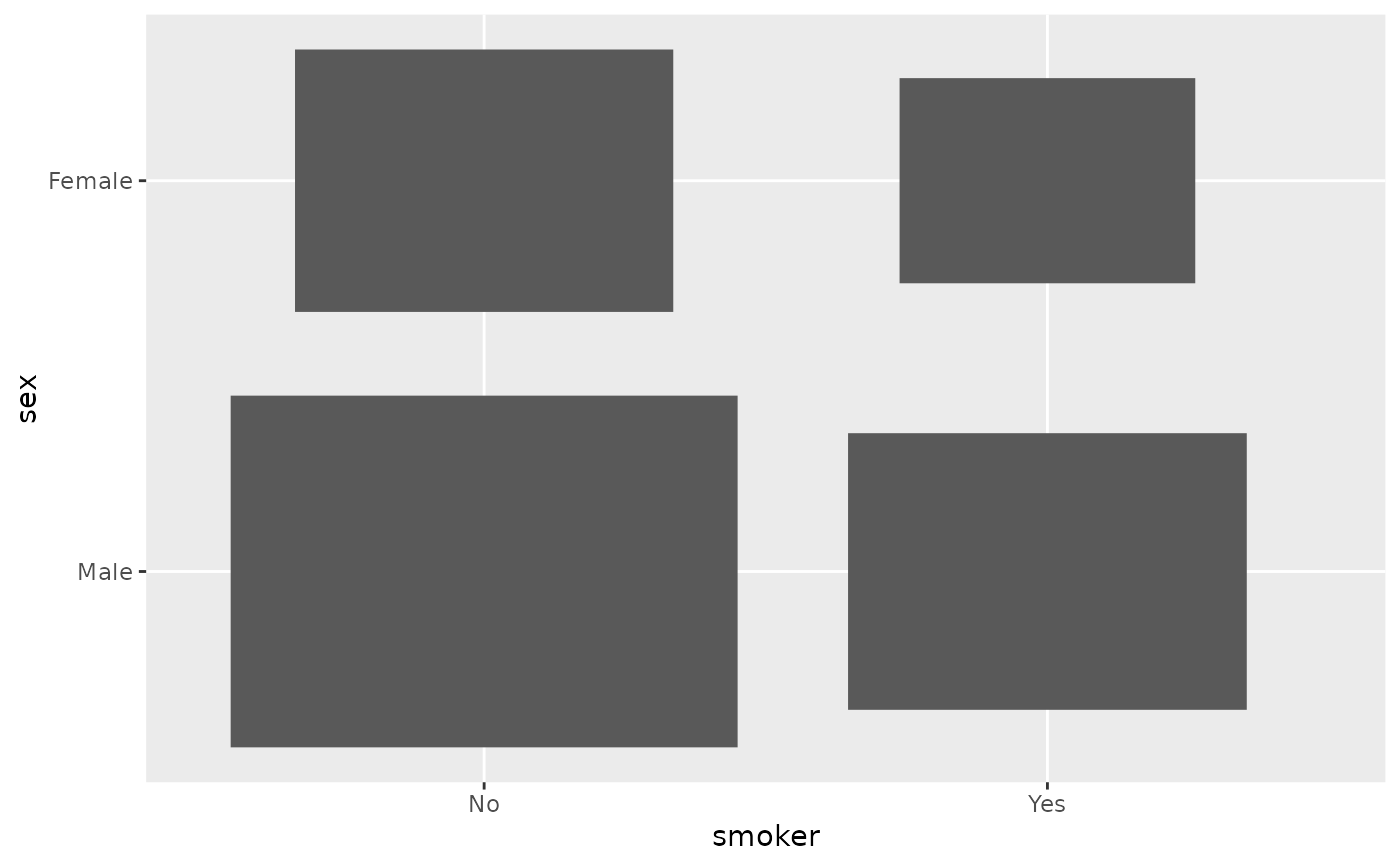
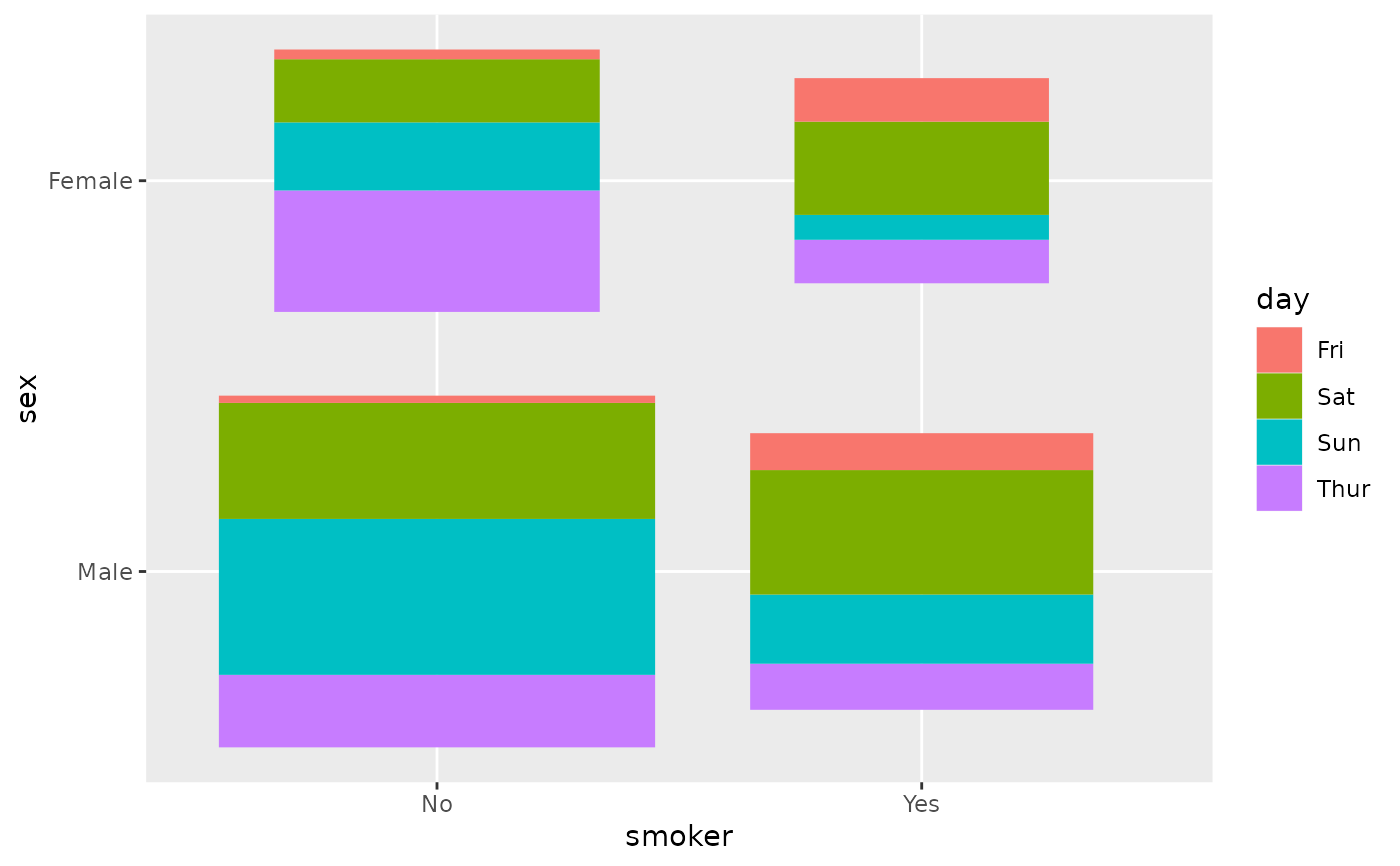
Plot the number of observations by using rectangles with proportional areas.
Arguments
- data
data set using
- mapping
aesthetics being used
- ...
other arguments passed to
geom_tile(...)
Examples
# Small function to display plots only if it's interactive
p_ <- GGally::print_if_interactive
data(tips)
p_(ggally_count(tips, mapping = ggplot2::aes(x = smoker, y = sex)))
 p_(ggally_count(tips, mapping = ggplot2::aes(x = smoker, y = sex, fill = day)))
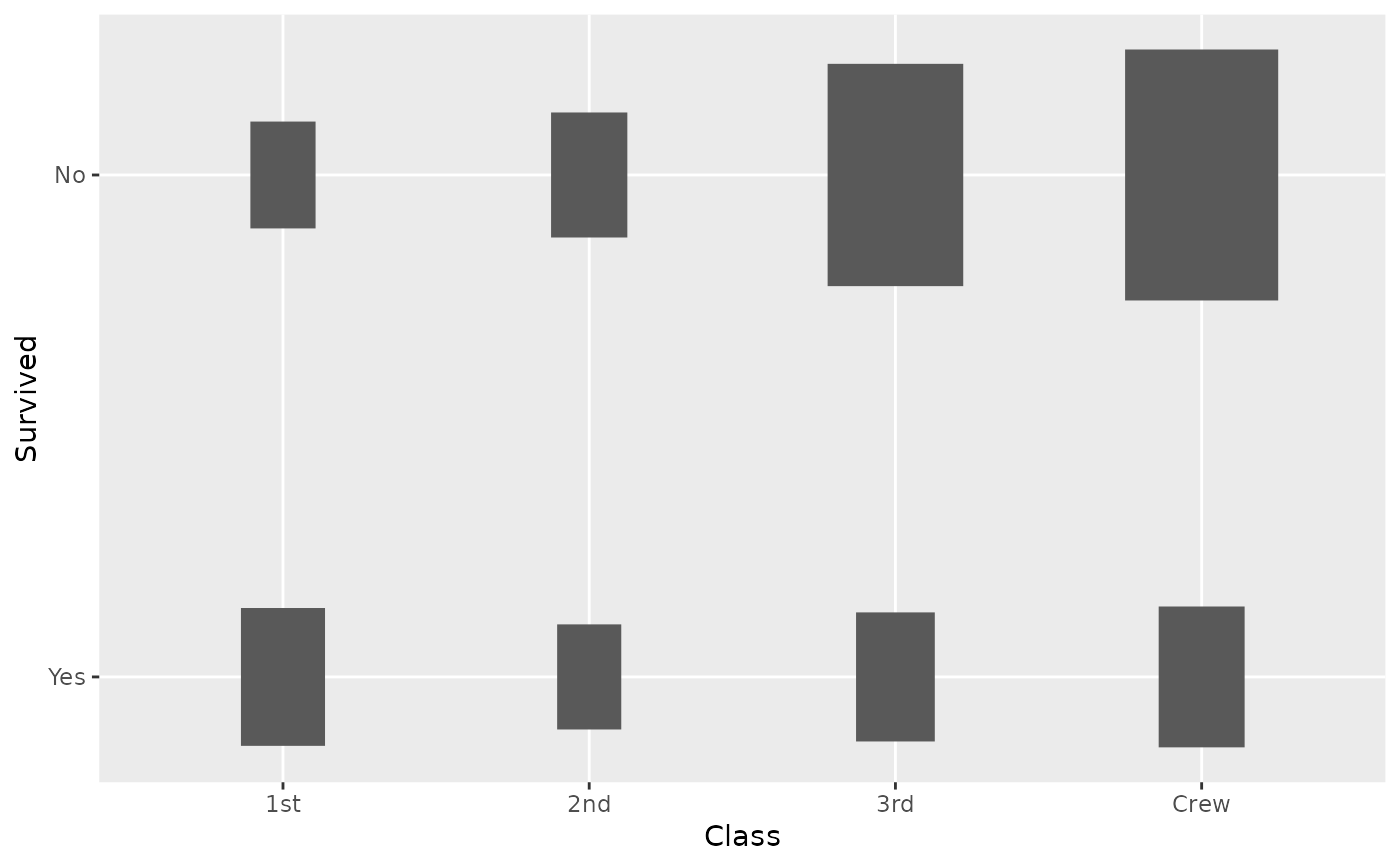
 p_(ggally_count(
as.data.frame(Titanic),
mapping = ggplot2::aes(x = Class, y = Survived, weight = Freq)
))
p_(ggally_count(
as.data.frame(Titanic),
mapping = ggplot2::aes(x = Class, y = Survived, weight = Freq)
))
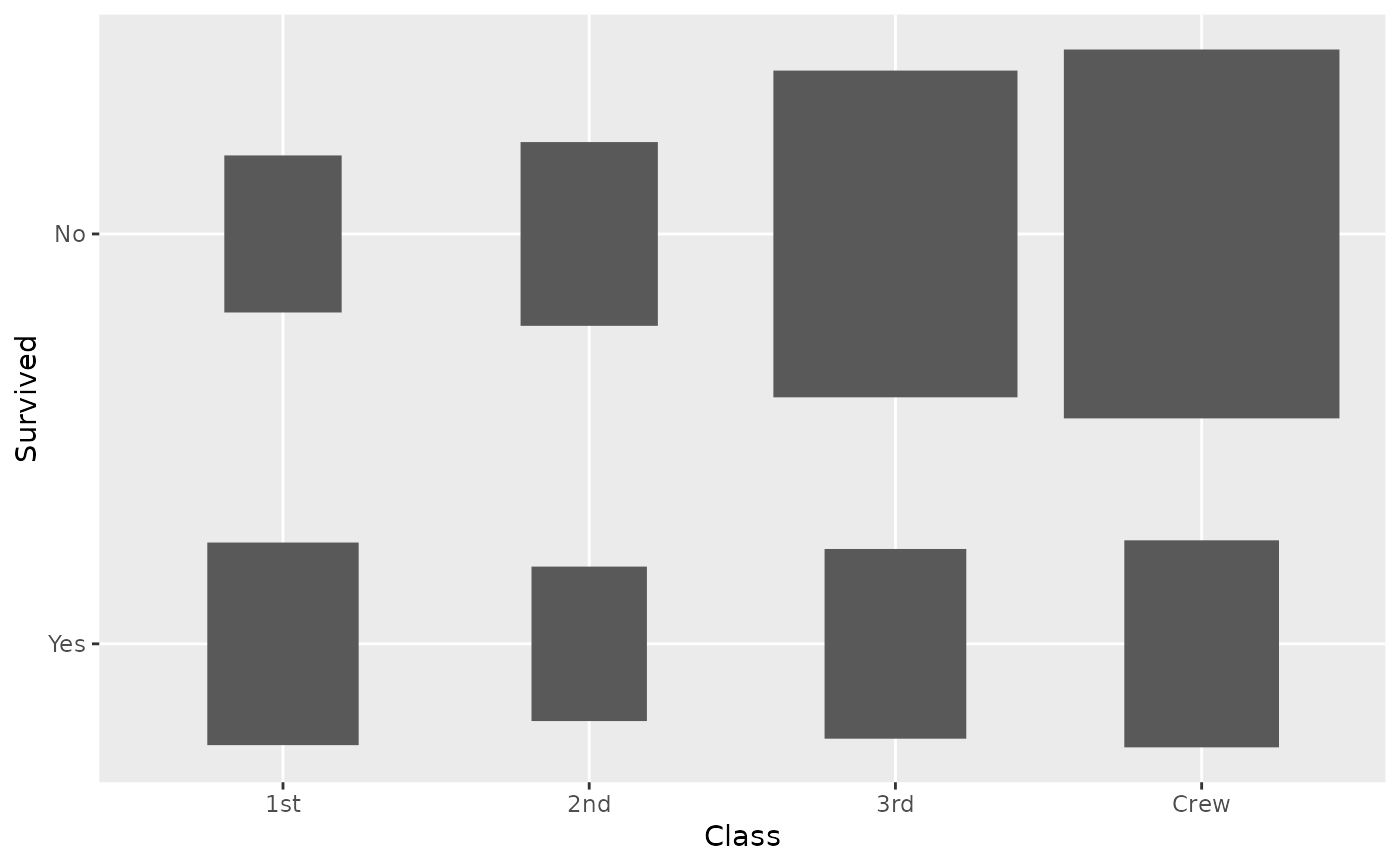 p_(ggally_count(
as.data.frame(Titanic),
mapping = ggplot2::aes(x = Class, y = Survived, weight = Freq),
x.width = 0.5
))
p_(ggally_count(
as.data.frame(Titanic),
mapping = ggplot2::aes(x = Class, y = Survived, weight = Freq),
x.width = 0.5
))
 # Small function to display plots only if it's interactive
p_ <- GGally::print_if_interactive
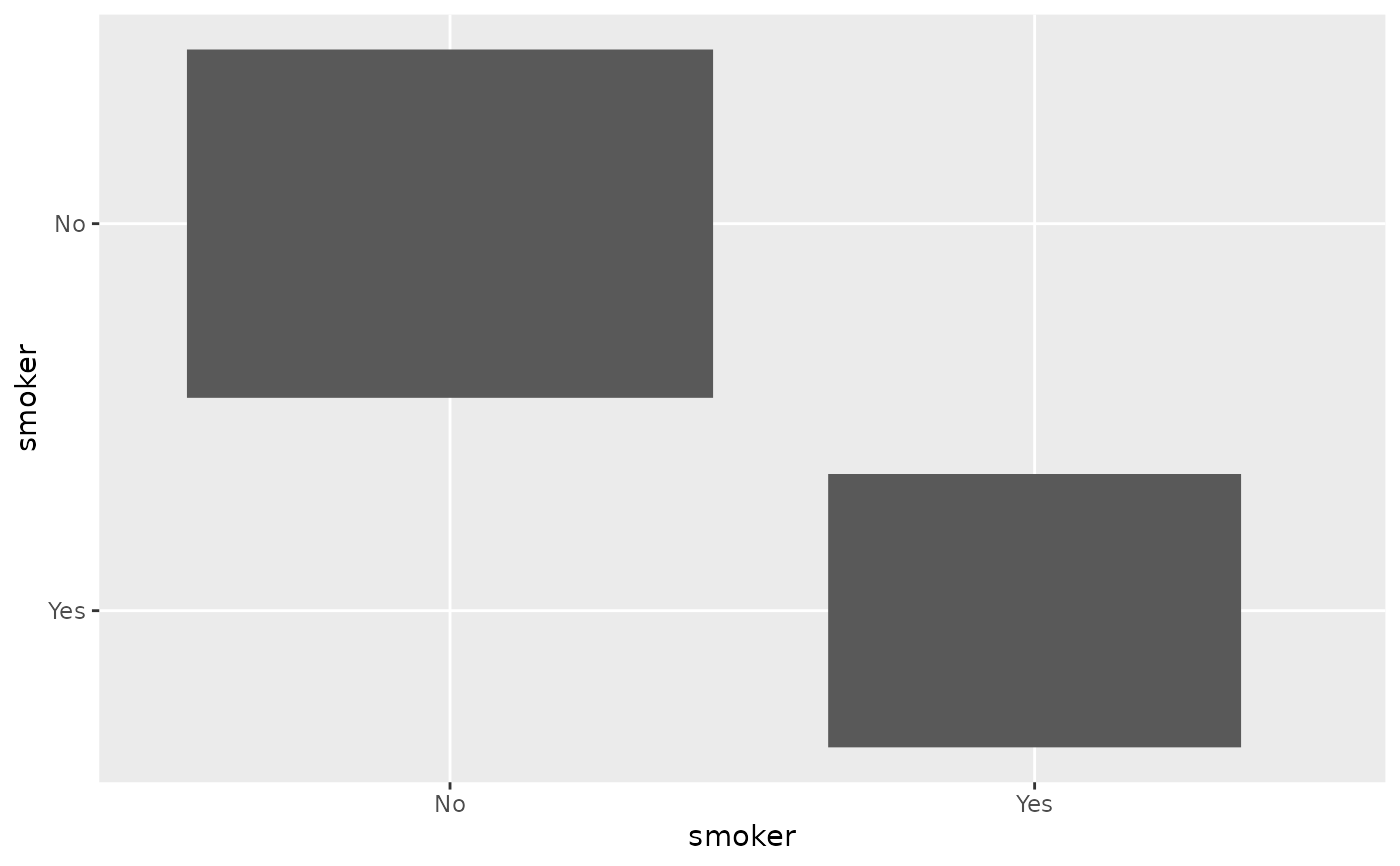
p_(ggally_countDiag(tips, mapping = ggplot2::aes(x = smoker)))
# Small function to display plots only if it's interactive
p_ <- GGally::print_if_interactive
p_(ggally_countDiag(tips, mapping = ggplot2::aes(x = smoker)))
 p_(ggally_countDiag(tips, mapping = ggplot2::aes(x = smoker, fill = sex)))