This function is used when axisLabels == "internal".
Usage
ggally_diagAxis(
  data,
  mapping,
  label = mapping$x,
  labelSize = 5,
  labelXPercent = 0.5,
  labelYPercent = 0.55,
  labelHJust = 0.5,
  labelVJust = 0.5,
  gridLabelSize = 4,
  ...
)
Arguments
- data
dataset being plotted
- mapping
aesthetics being used (x is the variable the plot will be made for)
- label
title to be displayed in the middle. Defaults to
mapping$x- labelSize
size of variable label
- labelXPercent
percent of horizontal range
- labelYPercent
percent of vertical range
- labelHJust
hjust supplied to label
- labelVJust
vjust supplied to label
- gridLabelSize
size of grid labels
- ...
other arguments for geom_text
Examples
# Small function to display plots only if it's interactive
p_ <- GGally::print_if_interactive
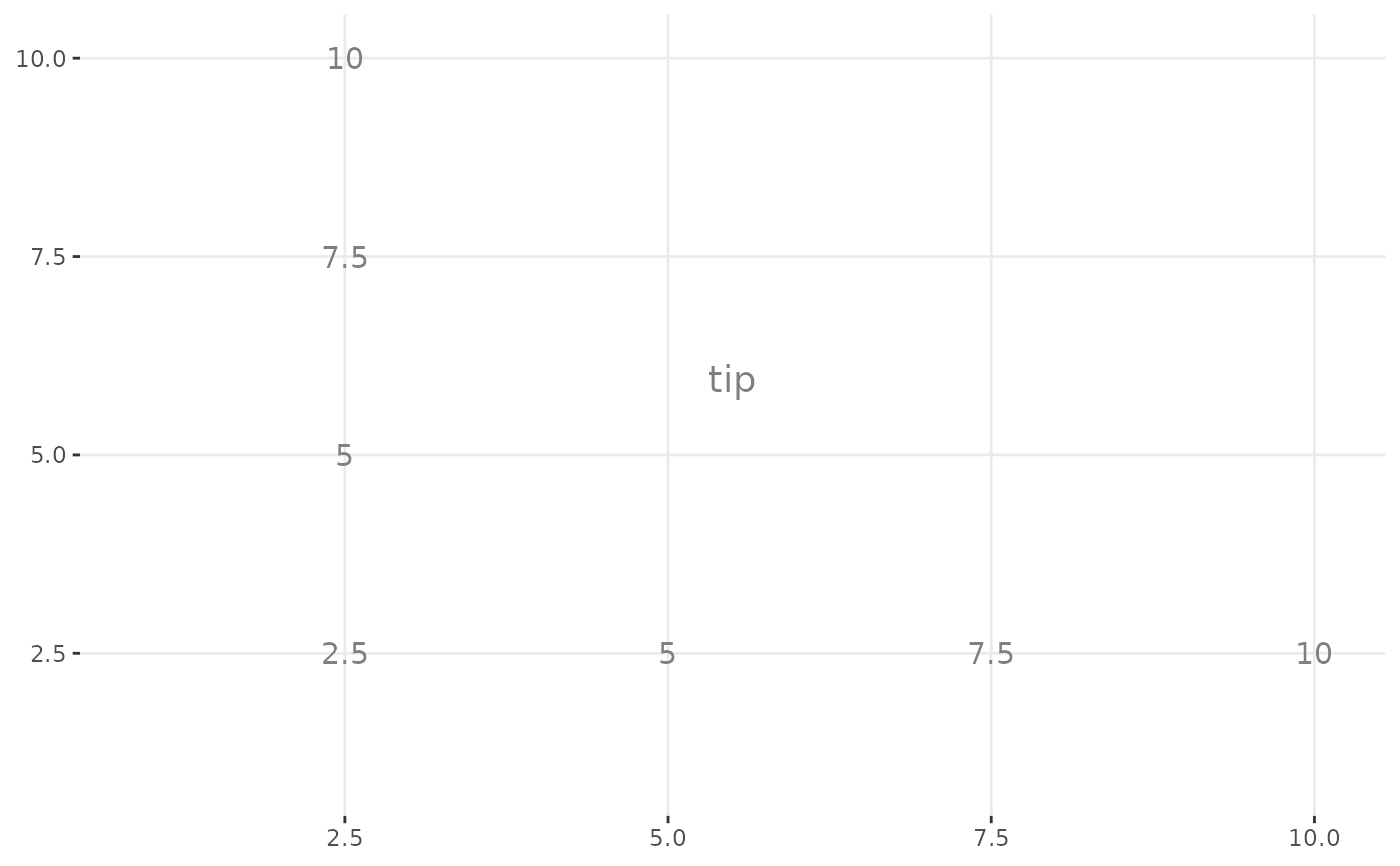
data(tips)
p_(ggally_diagAxis(tips, ggplot2::aes(x = tip)))
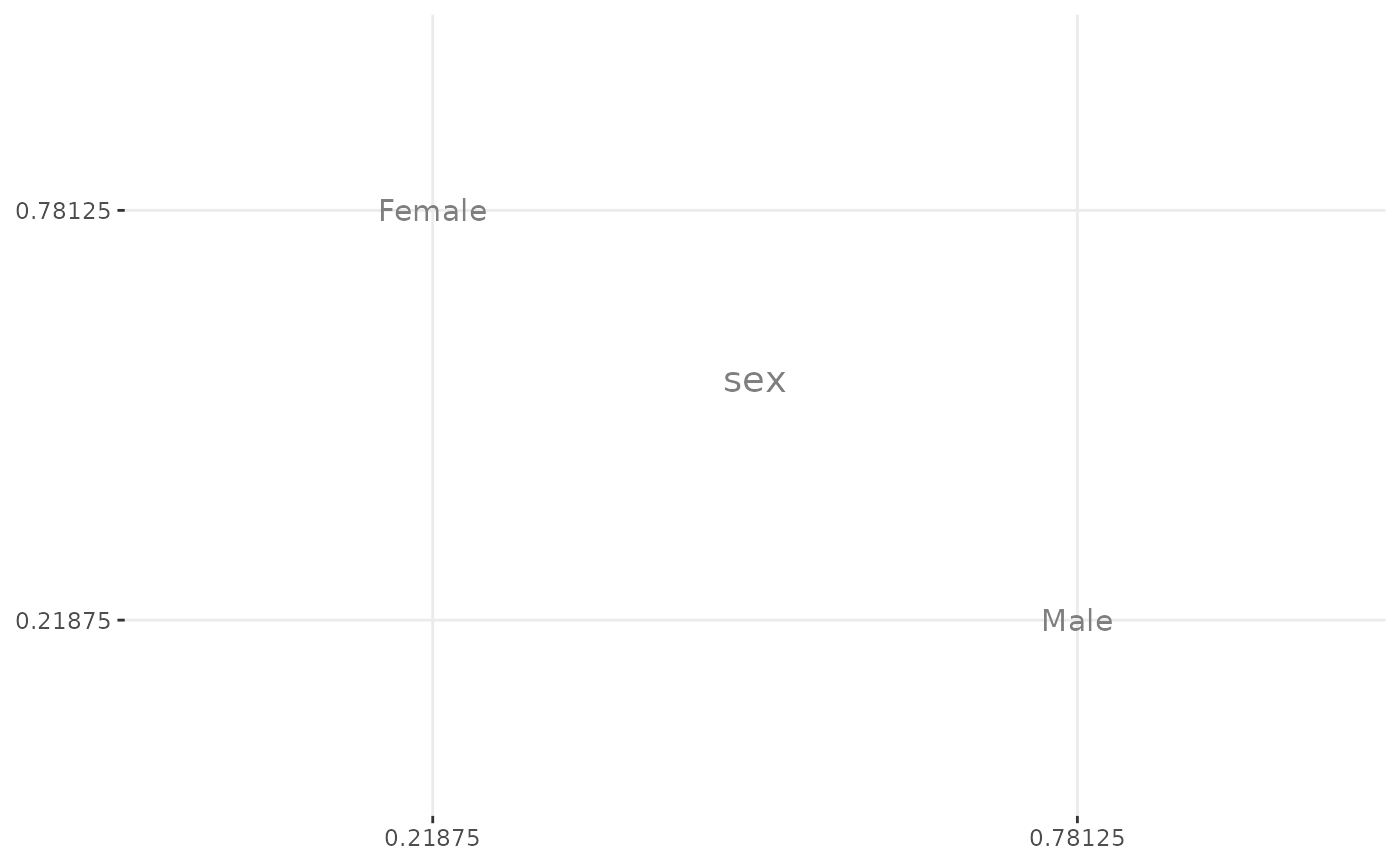
 p_(ggally_diagAxis(tips, ggplot2::aes(x = sex)))