Make a scatter plot with a given data set.
Examples
# Small function to display plots only if it's interactive
p_ <- GGally::print_if_interactive
data(mtcars)
p_(ggally_points(mtcars, mapping = ggplot2::aes(disp, hp)))
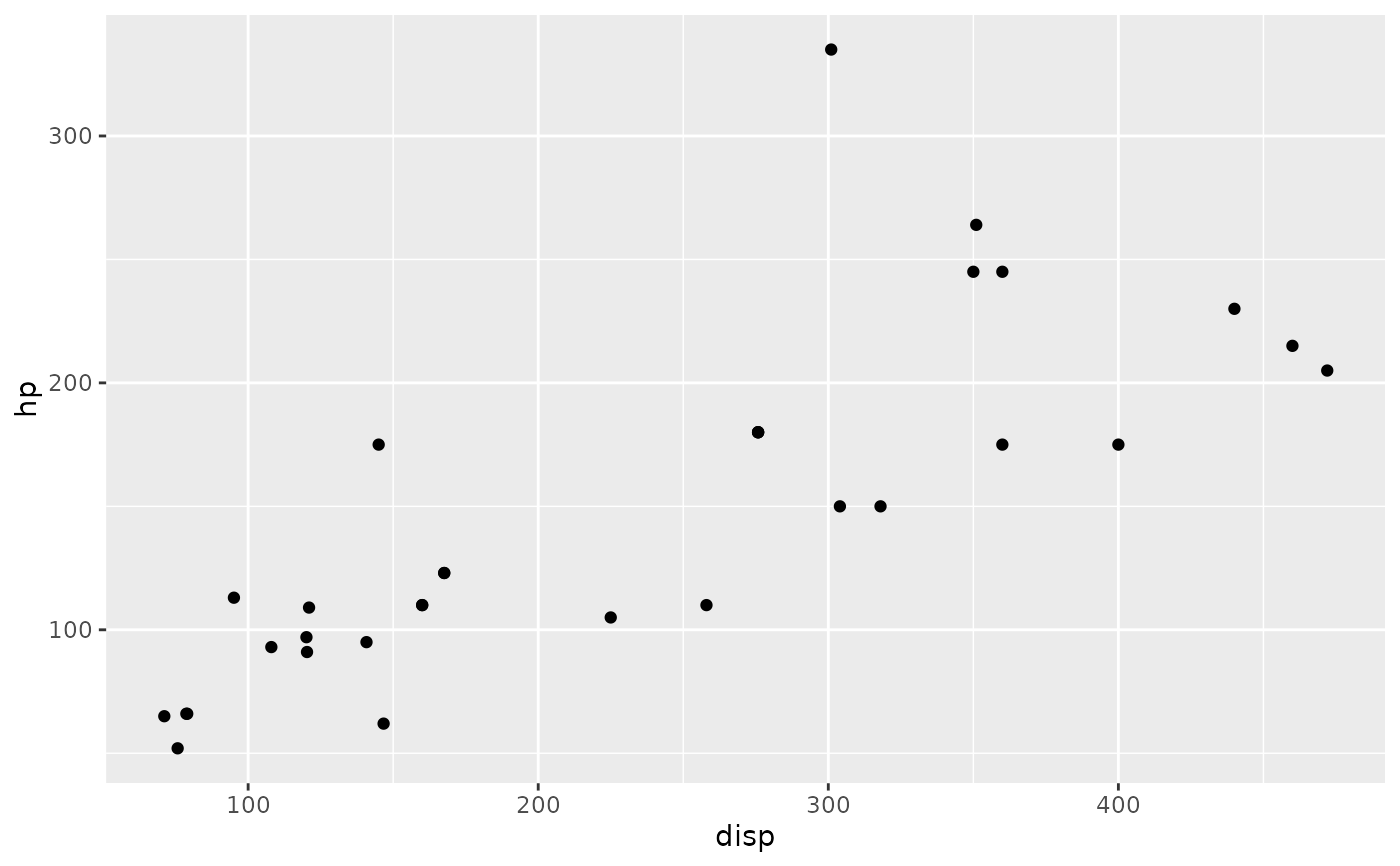 p_(ggally_points(mtcars, mapping = ggplot2::aes(disp, hp)))
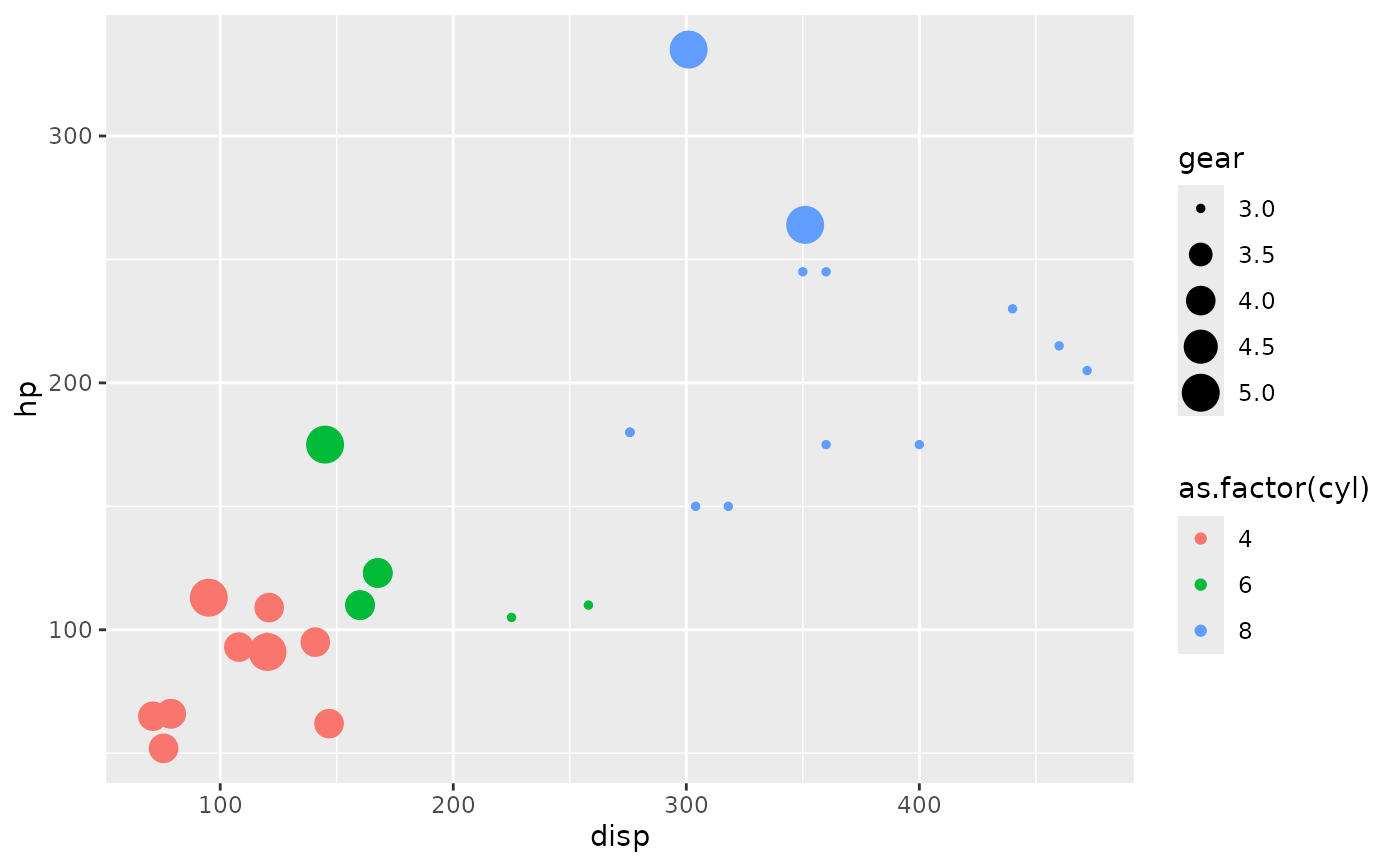
 p_(ggally_points(
mtcars,
mapping = ggplot2::aes(
x = disp,
y = hp,
color = as.factor(cyl),
size = gear
)
))
p_(ggally_points(
mtcars,
mapping = ggplot2::aes(
x = disp,
y = hp,
color = as.factor(cyl),
size = gear
)
))