Add a smoothed condition mean with a given scatter plot.
Usage
ggally_smooth(
  data,
  mapping,
  ...,
  method = "lm",
  formula = y ~ x,
  se = TRUE,
  shrink = TRUE
)

ggally_smooth_loess(data, mapping, ...)

ggally_smooth_lm(data, mapping, ...)
Arguments
- data
data set using
- mapping
aesthetics being used
- method, se
parameters supplied to
geom_smooth- formula, ...
other arguments to add to geom_smooth
- shrink
boolean to determine if y range is reduced to range of points or points and error ribbon
Details
Y limits are reduced to match original Y range with the goal of keeping the Y axis the same across plots.
Examples
# Small function to display plots only if it's interactive
p_ <- GGally::print_if_interactive
data(tips)
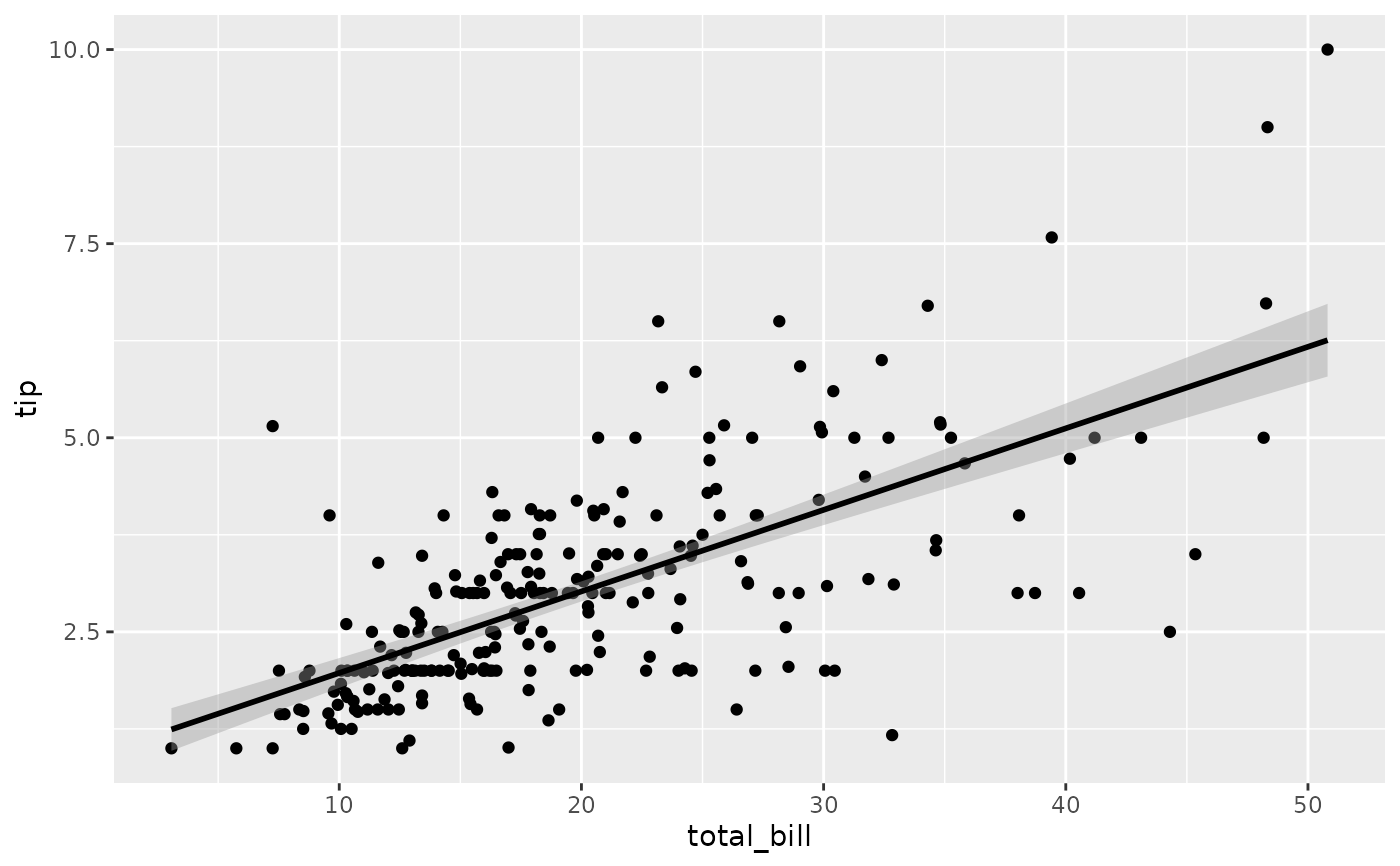
p_(ggally_smooth(tips, mapping = ggplot2::aes(x = total_bill, y = tip)))
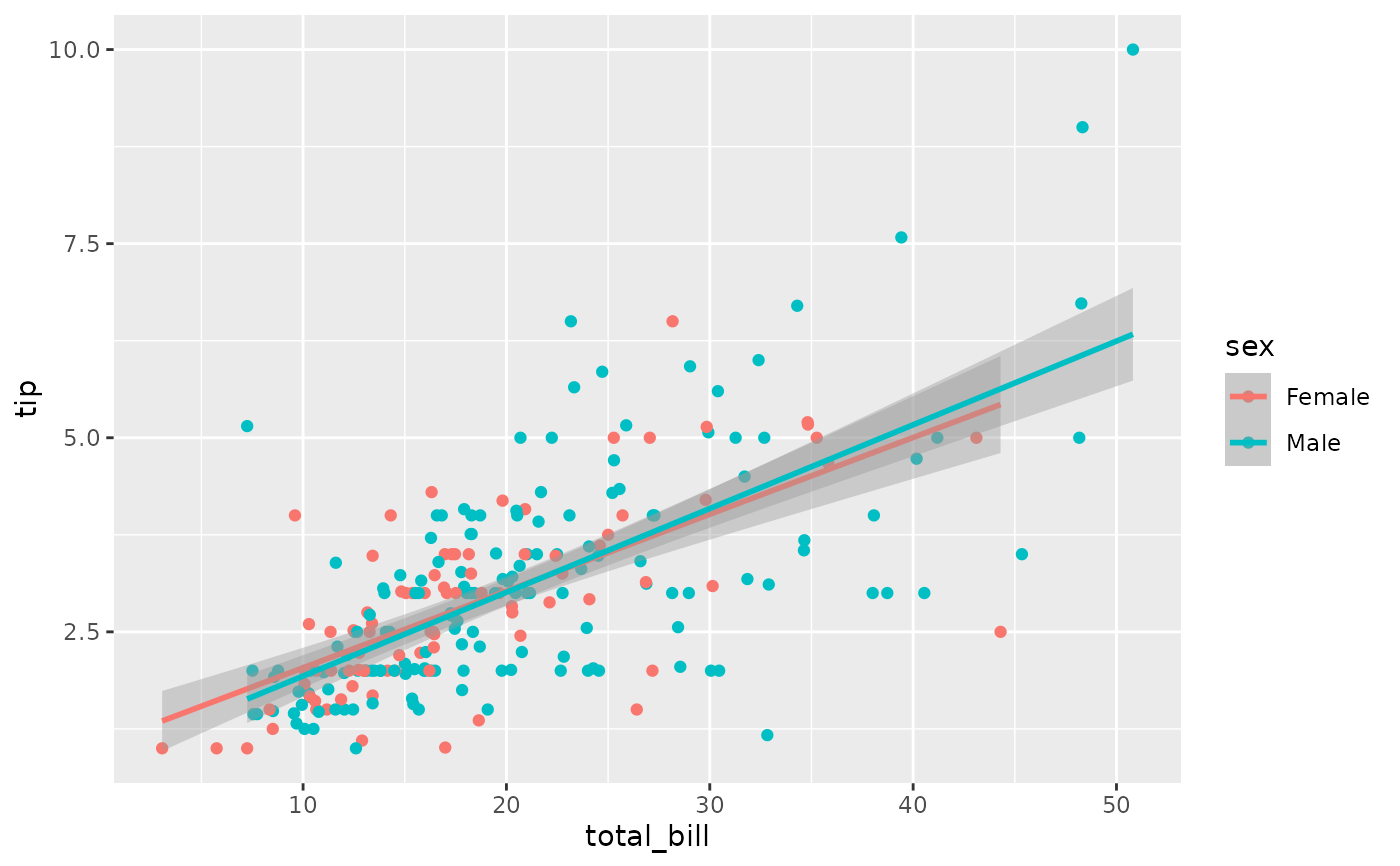
 p_(ggally_smooth(tips, mapping = ggplot2::aes(total_bill, tip, color = sex)))