Plot the number of observations as a table. Other statistics computed
by stat_cross could be used (see examples).
Usage
ggally_table(
  data,
  mapping,
  keep.zero.cells = FALSE,
  ...,
  geom_tile_args = NULL
)

ggally_tableDiag(
  data,
  mapping,
  keep.zero.cells = FALSE,
  ...,
  geom_tile_args = NULL
)Examples
# Small function to display plots only if it's interactive
p_ <- GGally::print_if_interactive
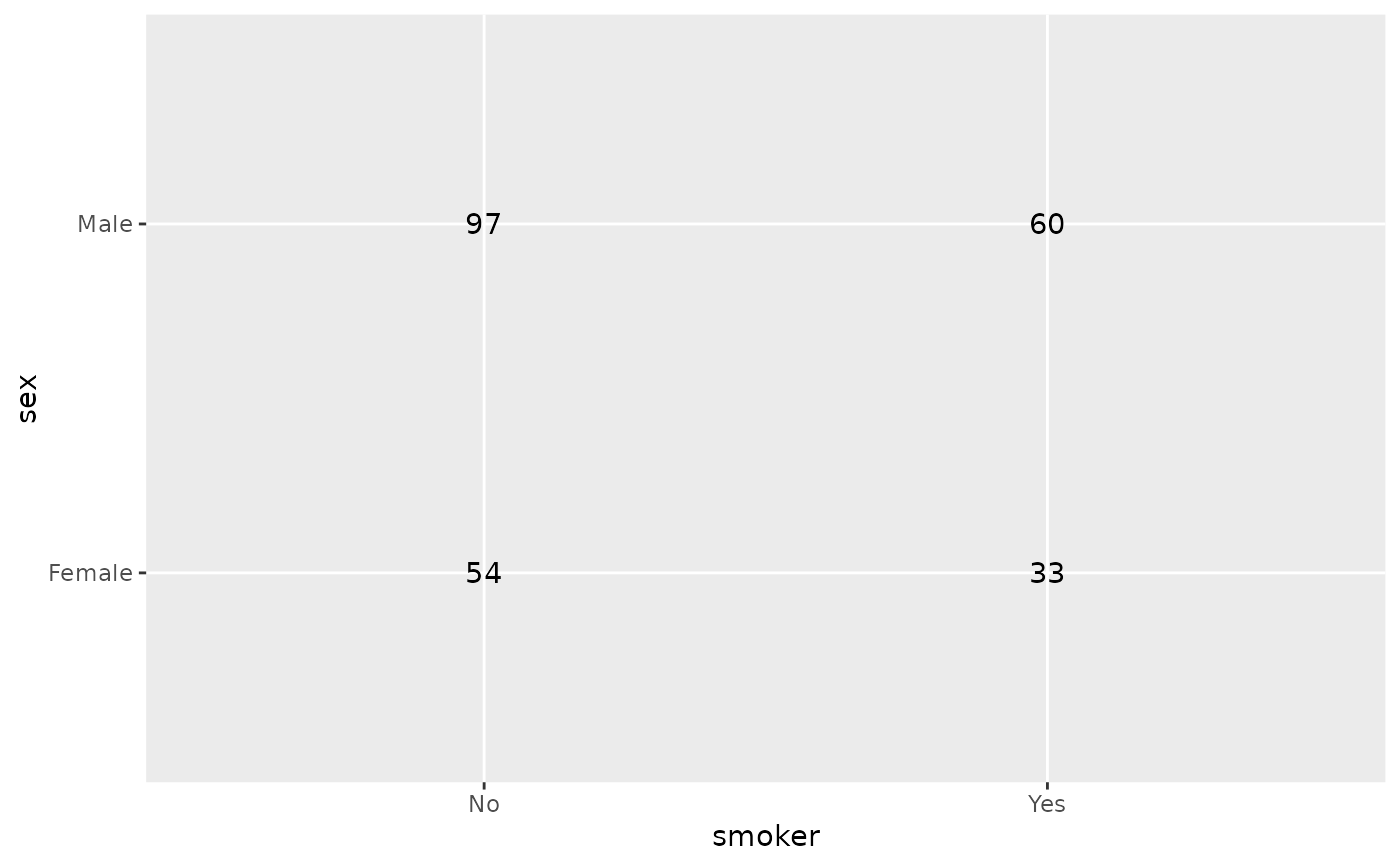
data(tips)
p_(ggally_table(tips, mapping = aes(x = smoker, y = sex)))
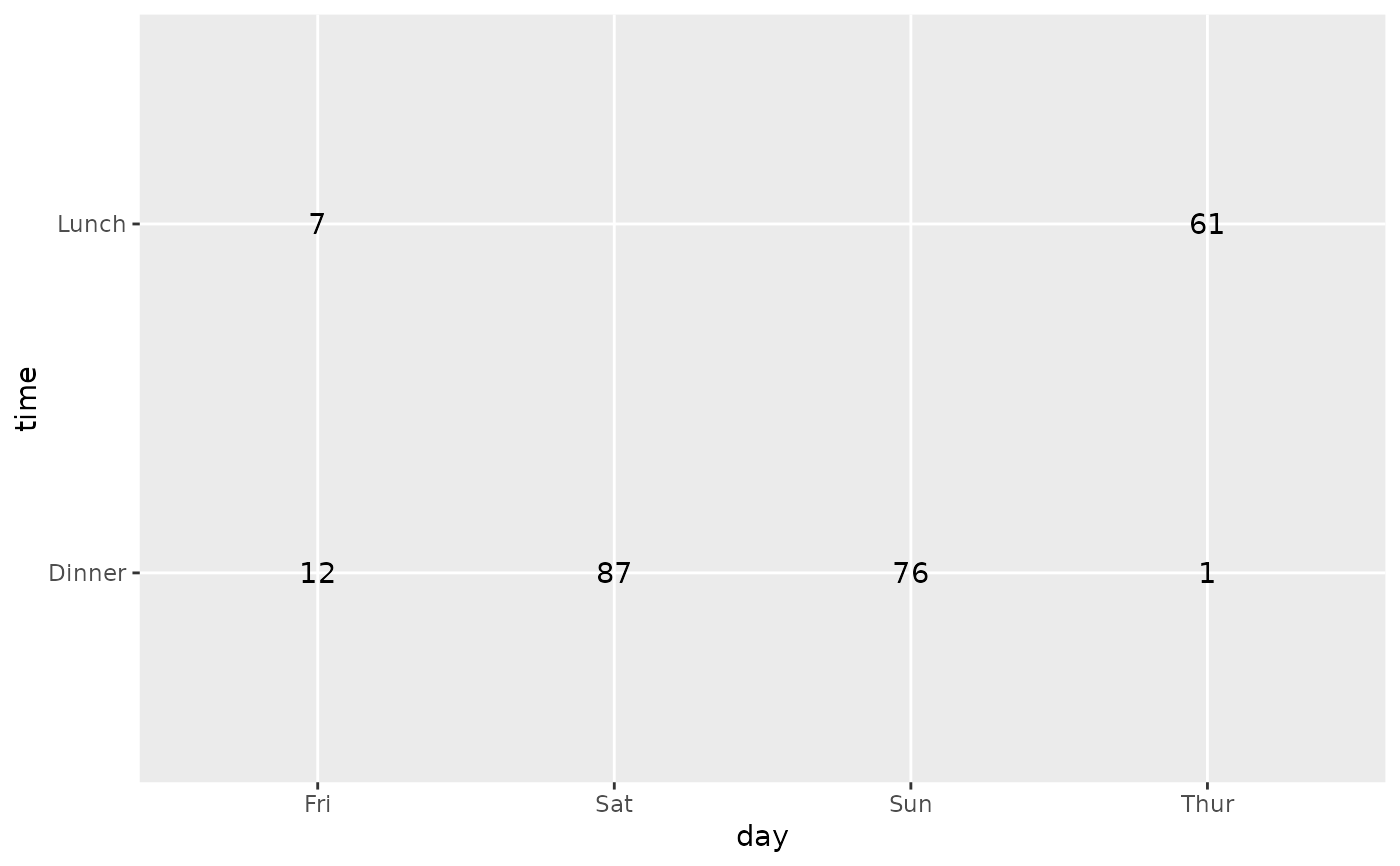
 p_(ggally_table(tips, mapping = aes(x = day, y = time)))
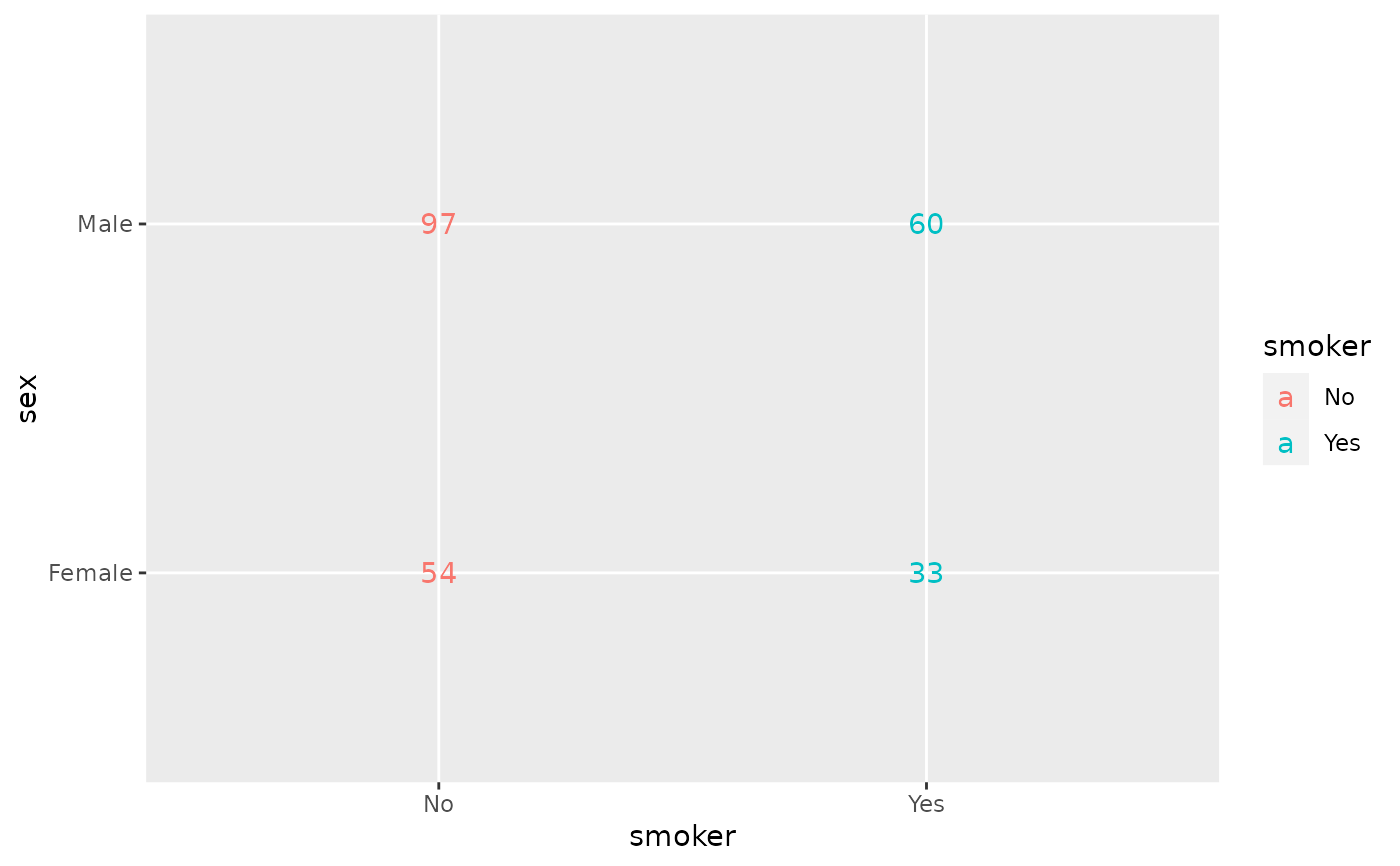
 p_(ggally_table(tips, mapping = aes(x = smoker, y = sex, colour = smoker)))
 # colour is kept only if equal to x or y
p_(ggally_table(tips, mapping = aes(x = smoker, y = sex, colour = day)))
# colour is kept only if equal to x or y
p_(ggally_table(tips, mapping = aes(x = smoker, y = sex, colour = day)))
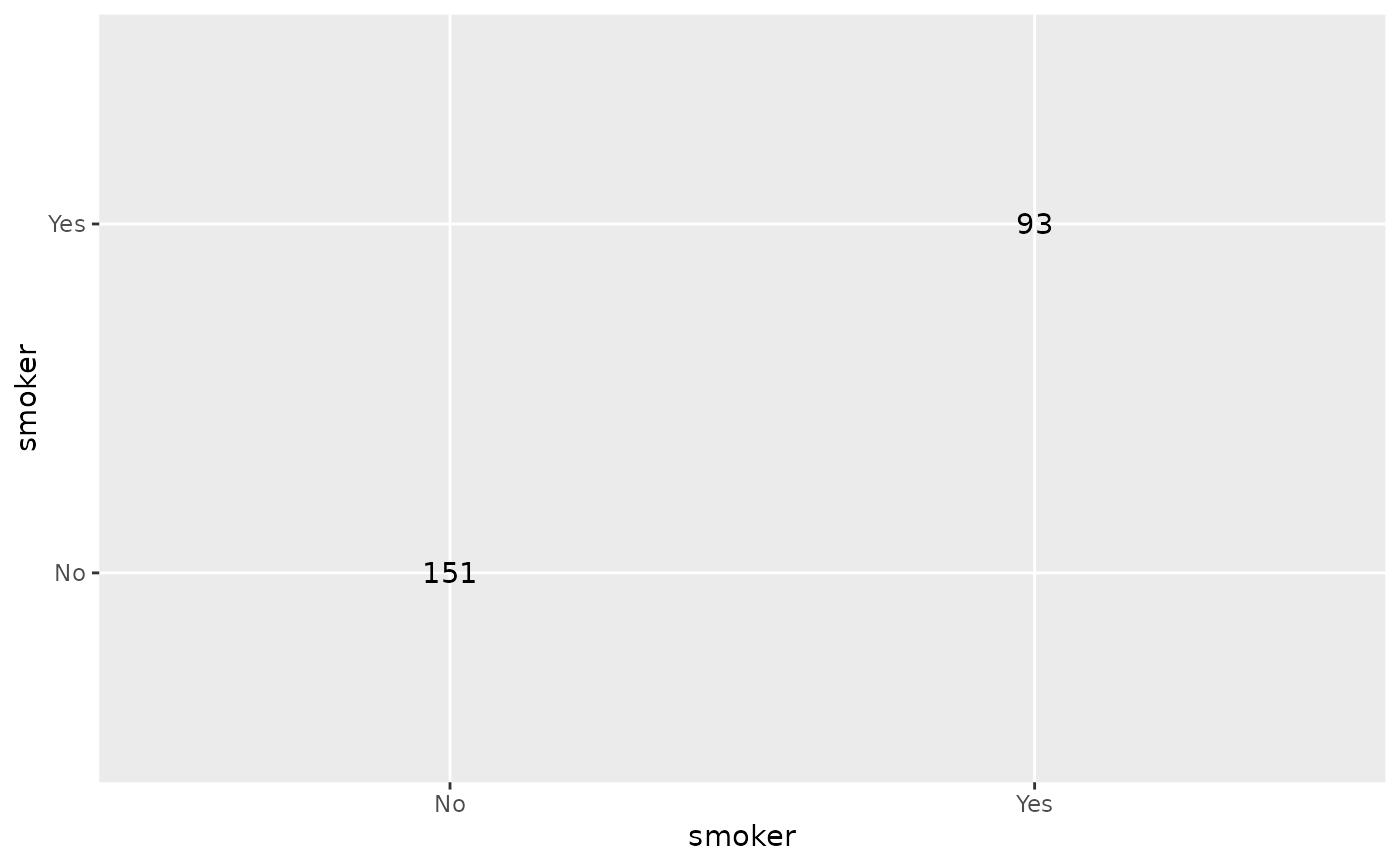
 # diagonal version
p_(ggally_tableDiag(tips, mapping = aes(x = smoker)))
# diagonal version
p_(ggally_tableDiag(tips, mapping = aes(x = smoker)))
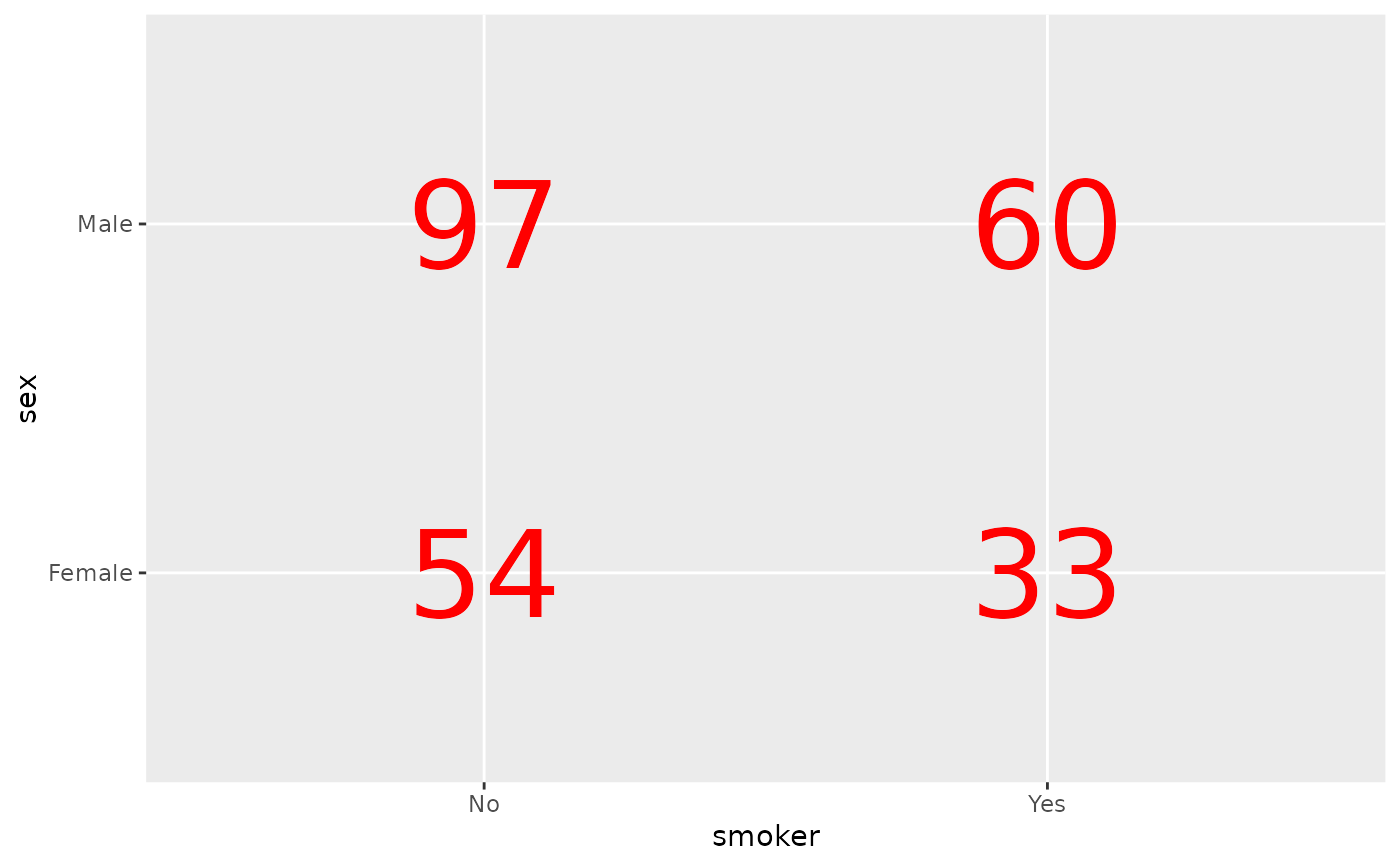
 # custom label size and color
p_(ggally_table(tips, mapping = aes(x = smoker, y = sex), size = 16, color = "red"))
# custom label size and color
p_(ggally_table(tips, mapping = aes(x = smoker, y = sex), size = 16, color = "red"))
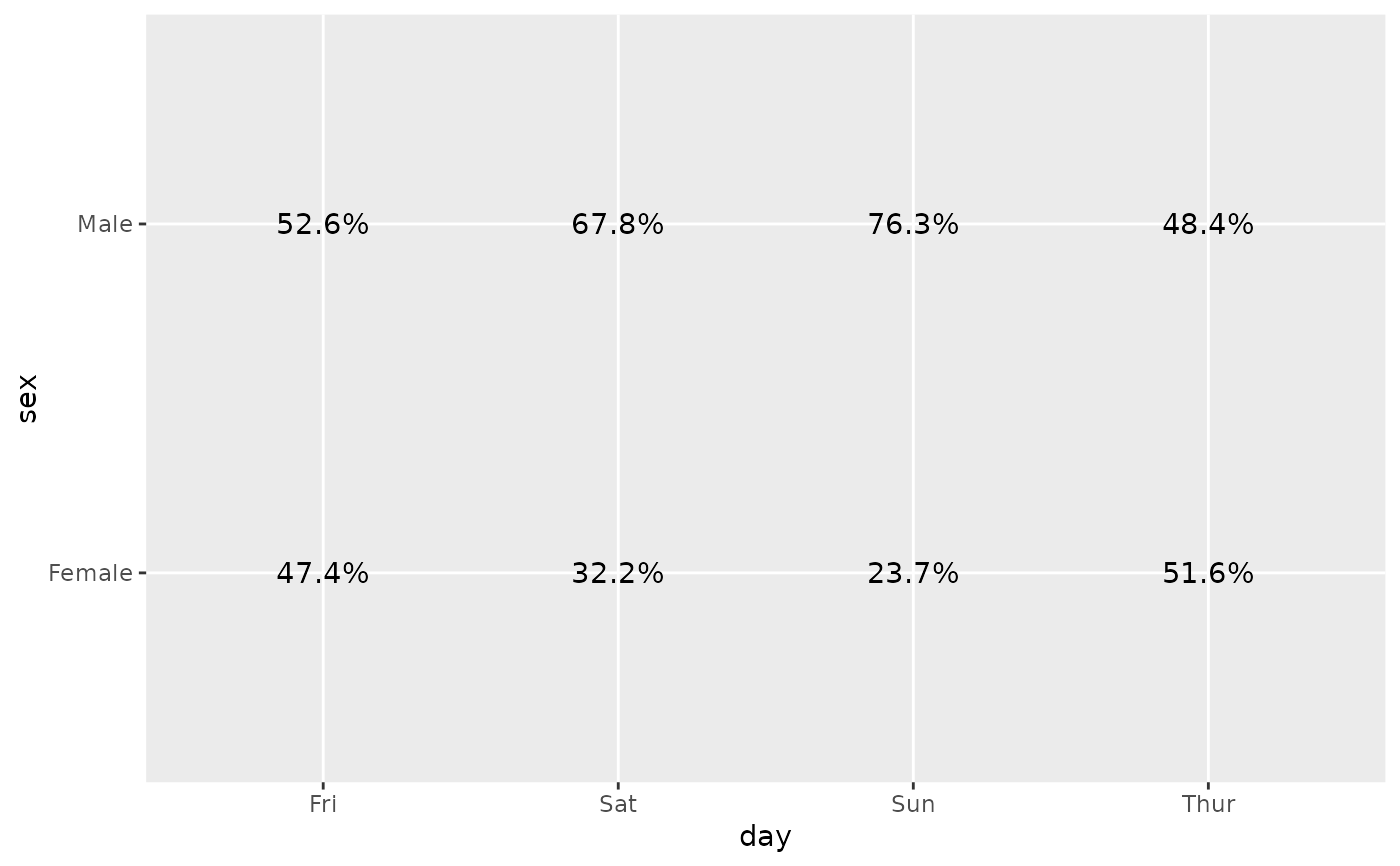
 # display column proportions
p_(ggally_table(
tips,
mapping = aes(x = day, y = sex, label = scales::percent(after_stat(col.prop)))
))
# display column proportions
p_(ggally_table(
tips,
mapping = aes(x = day, y = sex, label = scales::percent(after_stat(col.prop)))
))
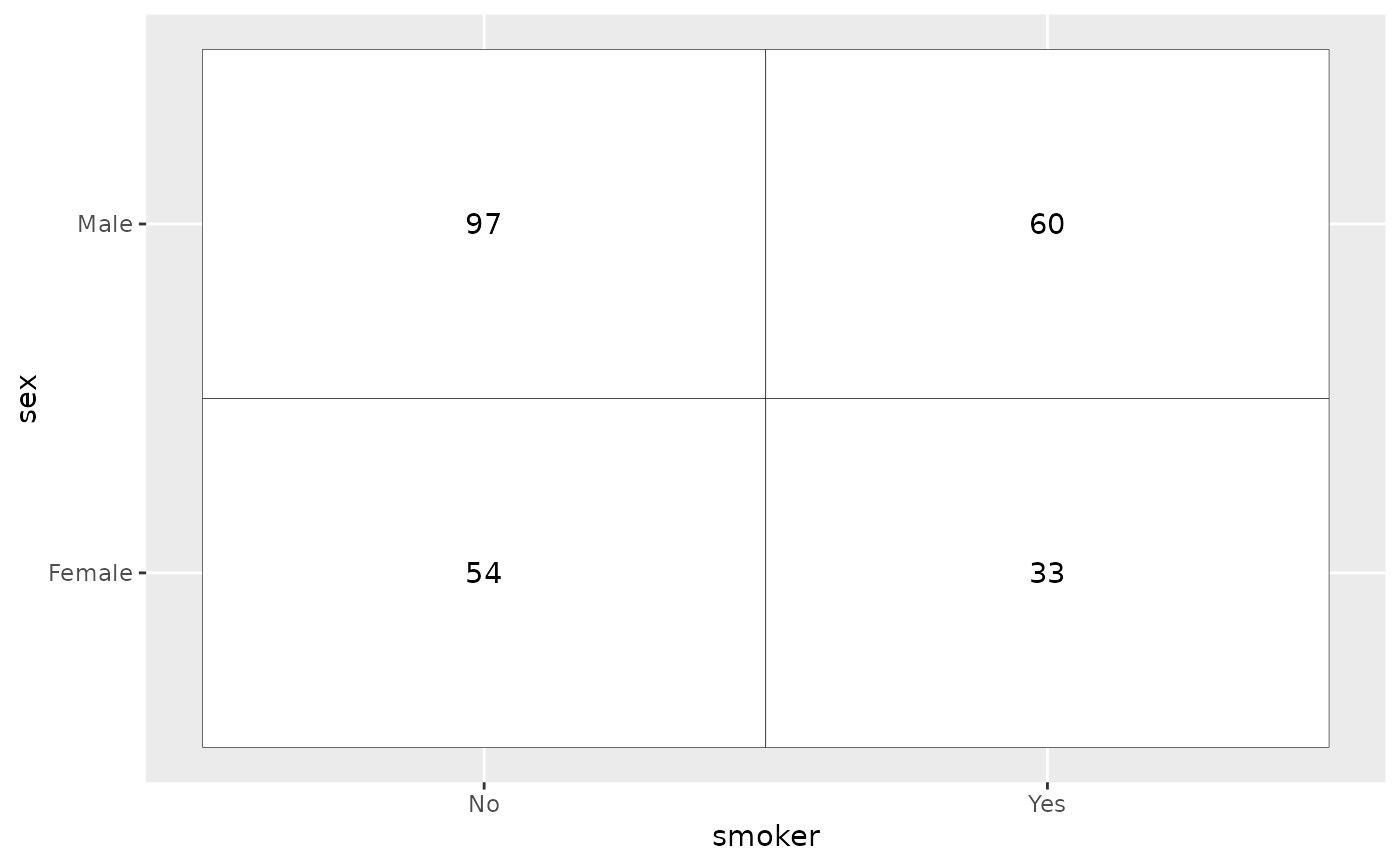
 # draw table cells
p_(ggally_table(
tips,
mapping = aes(x = smoker, y = sex),
geom_tile_args = list(colour = "black", fill = "white")
))
# draw table cells
p_(ggally_table(
tips,
mapping = aes(x = smoker, y = sex),
geom_tile_args = list(colour = "black", fill = "white")
))
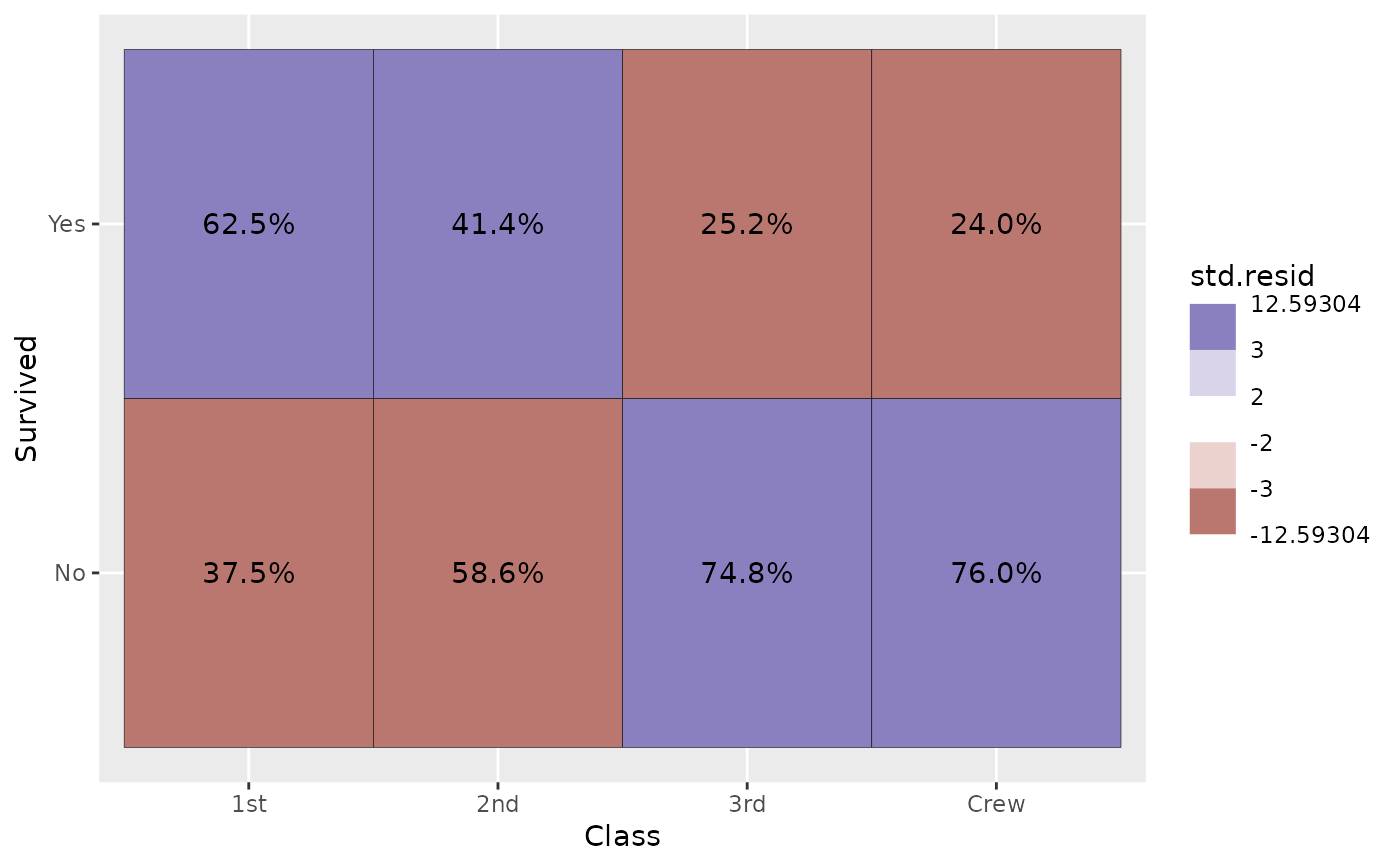
 # Use standardized residuals to fill table cells
p_(ggally_table(
as.data.frame(Titanic),
mapping = aes(
x = Class, y = Survived, weight = Freq,
fill = after_stat(std.resid),
label = scales::percent(after_stat(col.prop), accuracy = .1)
),
geom_tile_args = list(colour = "black")
) +
scale_fill_steps2(breaks = c(-3, -2, 2, 3), show.limits = TRUE))
# Use standardized residuals to fill table cells
p_(ggally_table(
as.data.frame(Titanic),
mapping = aes(
x = Class, y = Survived, weight = Freq,
fill = after_stat(std.resid),
label = scales::percent(after_stat(col.prop), accuracy = .1)
),
geom_tile_args = list(colour = "black")
) +
scale_fill_steps2(breaks = c(-3, -2, 2, 3), show.limits = TRUE))