Plot trends using line plots. For continuous y variables, plot the evolution of the mean. For binary y variables, plot the evolution of the proportion.
Arguments
- data
data set using
- mapping
aesthetics being used
- ...
other arguments passed to
ggplot2::geom_line()- include_zero
Should 0 be included on the y-axis?
Examples
# Small function to display plots only if it's interactive
p_ <- GGally::print_if_interactive
data(tips)
tips_f <- tips
tips_f$day <- factor(tips$day, c("Thur", "Fri", "Sat", "Sun"))
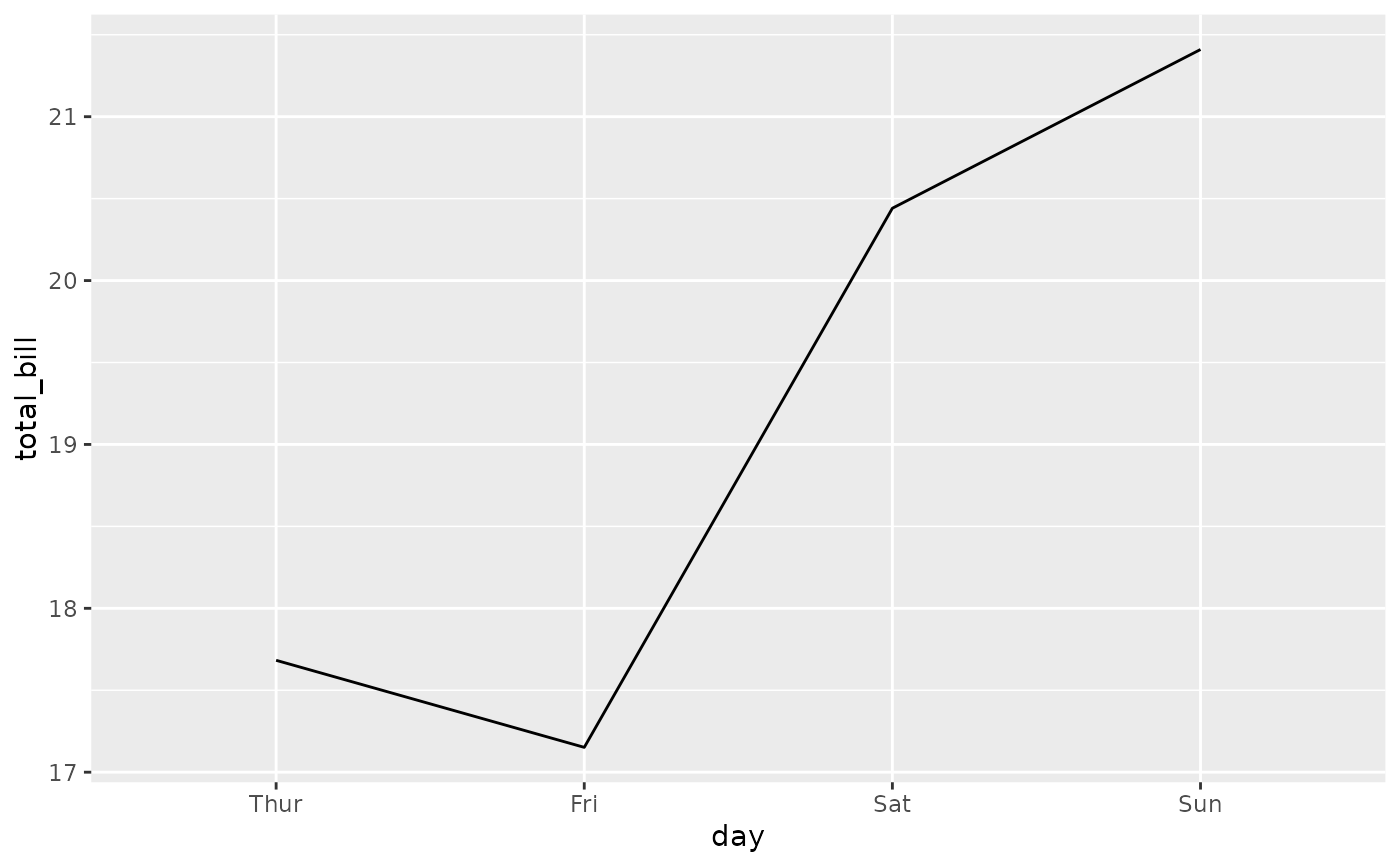
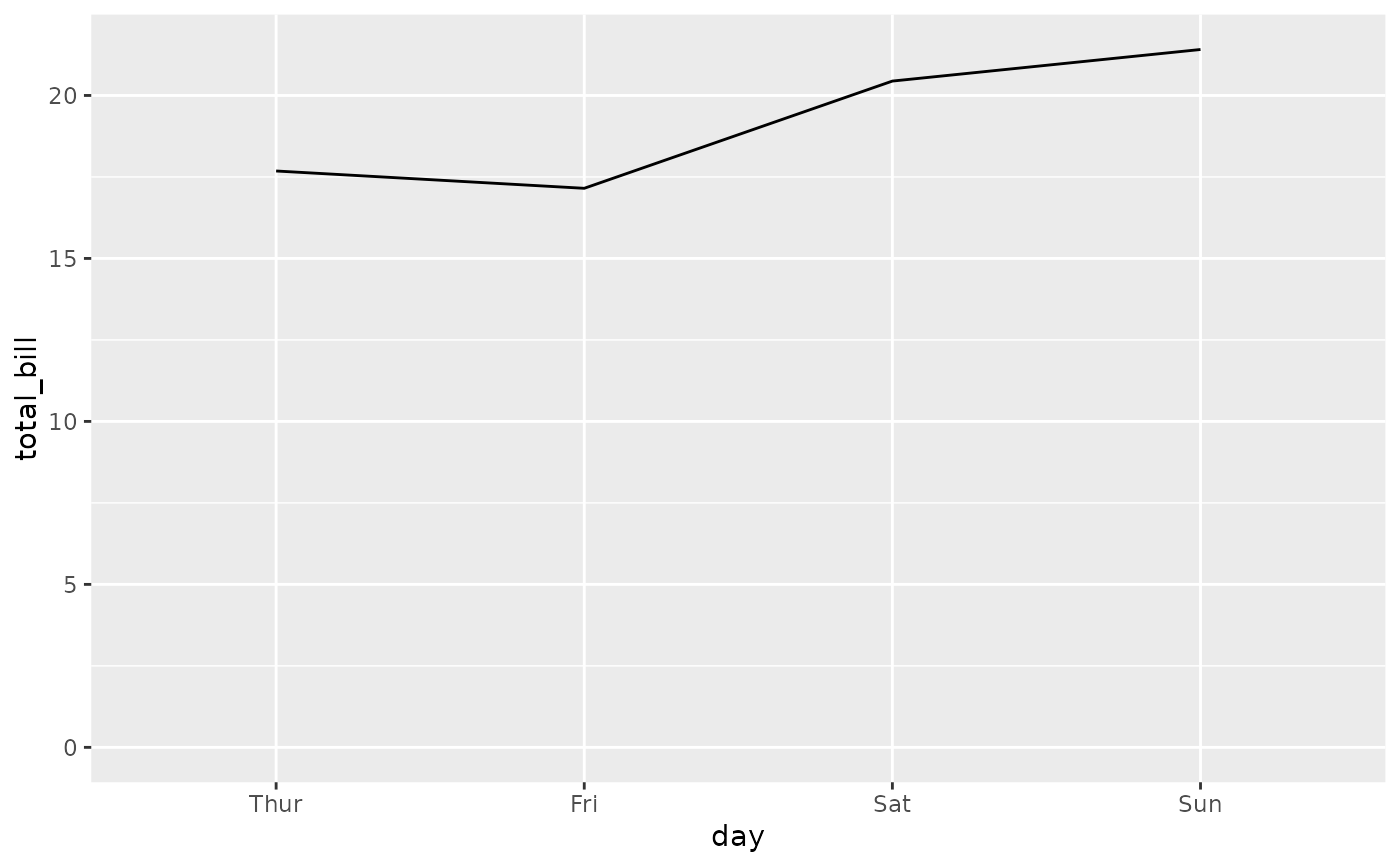
# Numeric variable
p_(ggally_trends(tips_f, mapping = aes(x = day, y = total_bill)))
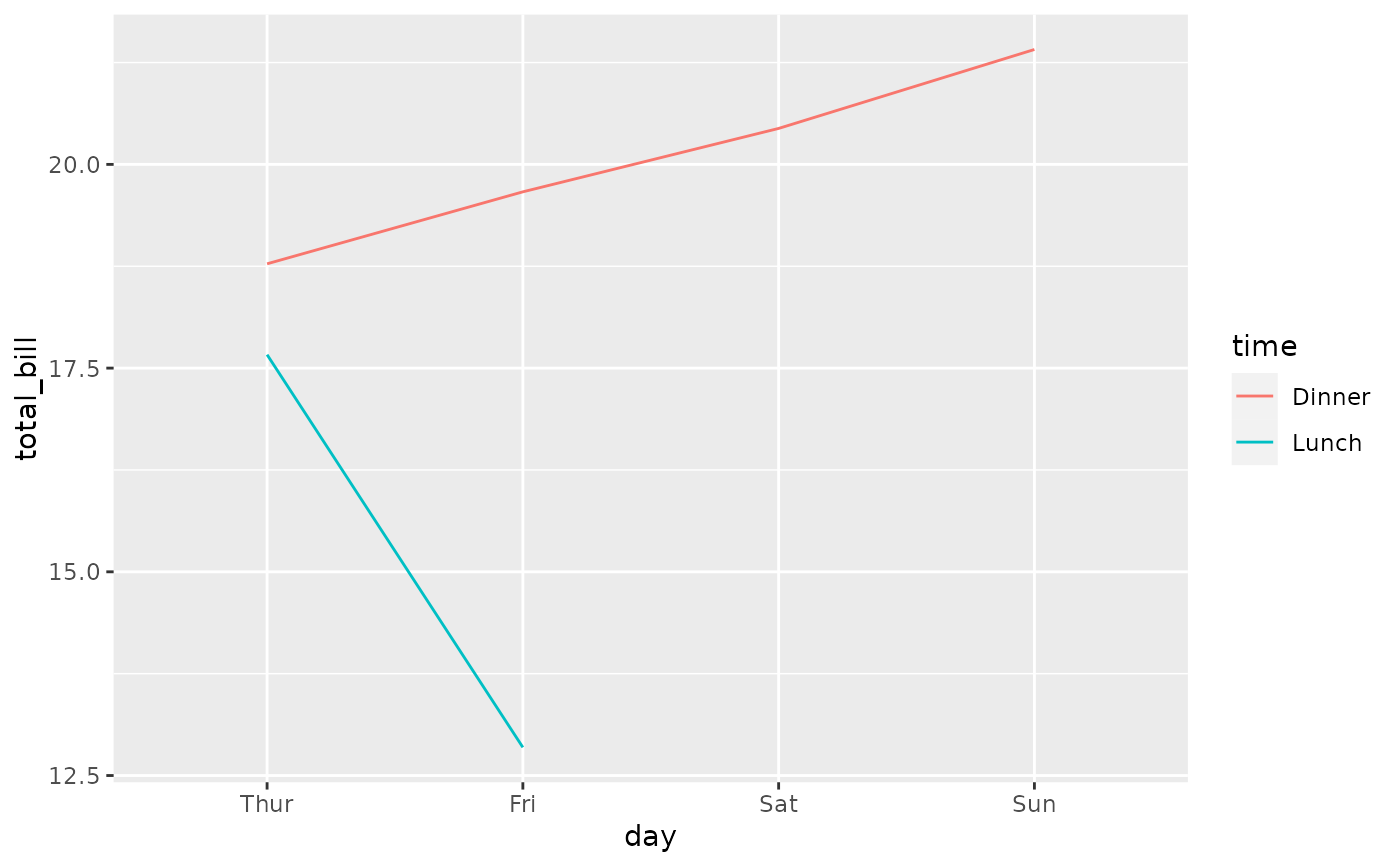
 p_(ggally_trends(tips_f, mapping = aes(x = day, y = total_bill, colour = time)))
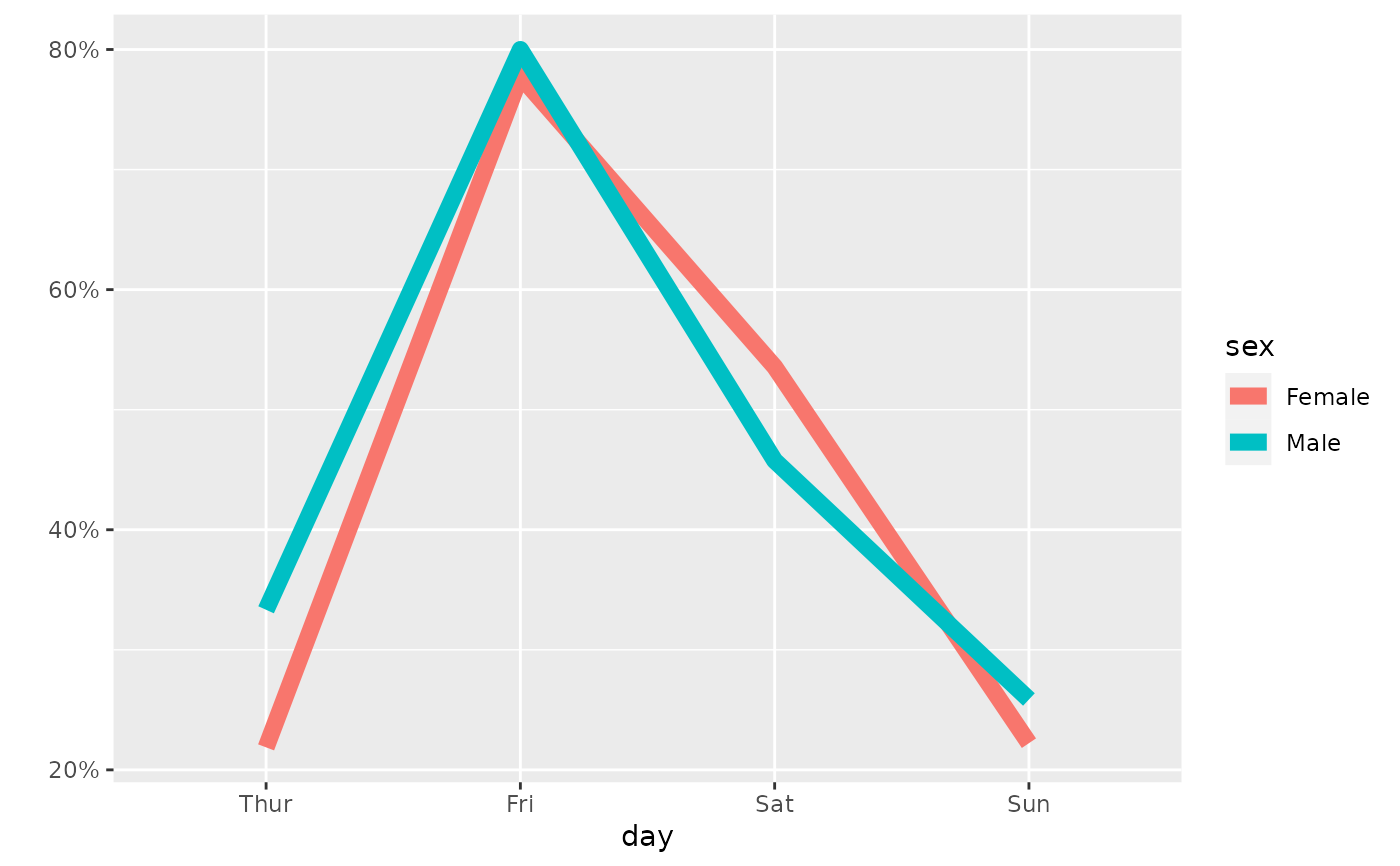
 # Binary variable
p_(ggally_trends(tips_f, mapping = aes(x = day, y = smoker)))
# Binary variable
p_(ggally_trends(tips_f, mapping = aes(x = day, y = smoker)))
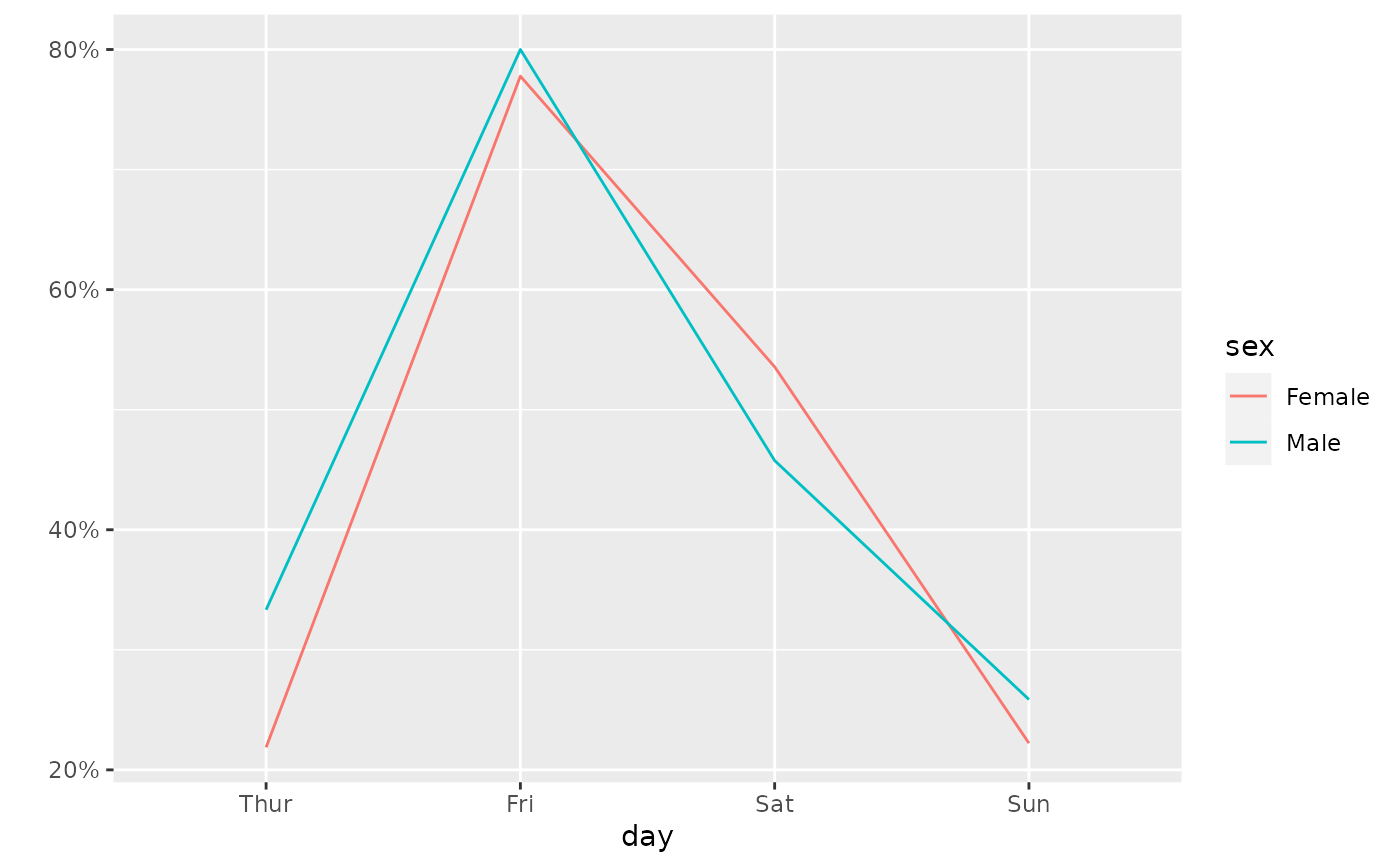
 p_(ggally_trends(tips_f, mapping = aes(x = day, y = smoker, colour = sex)))
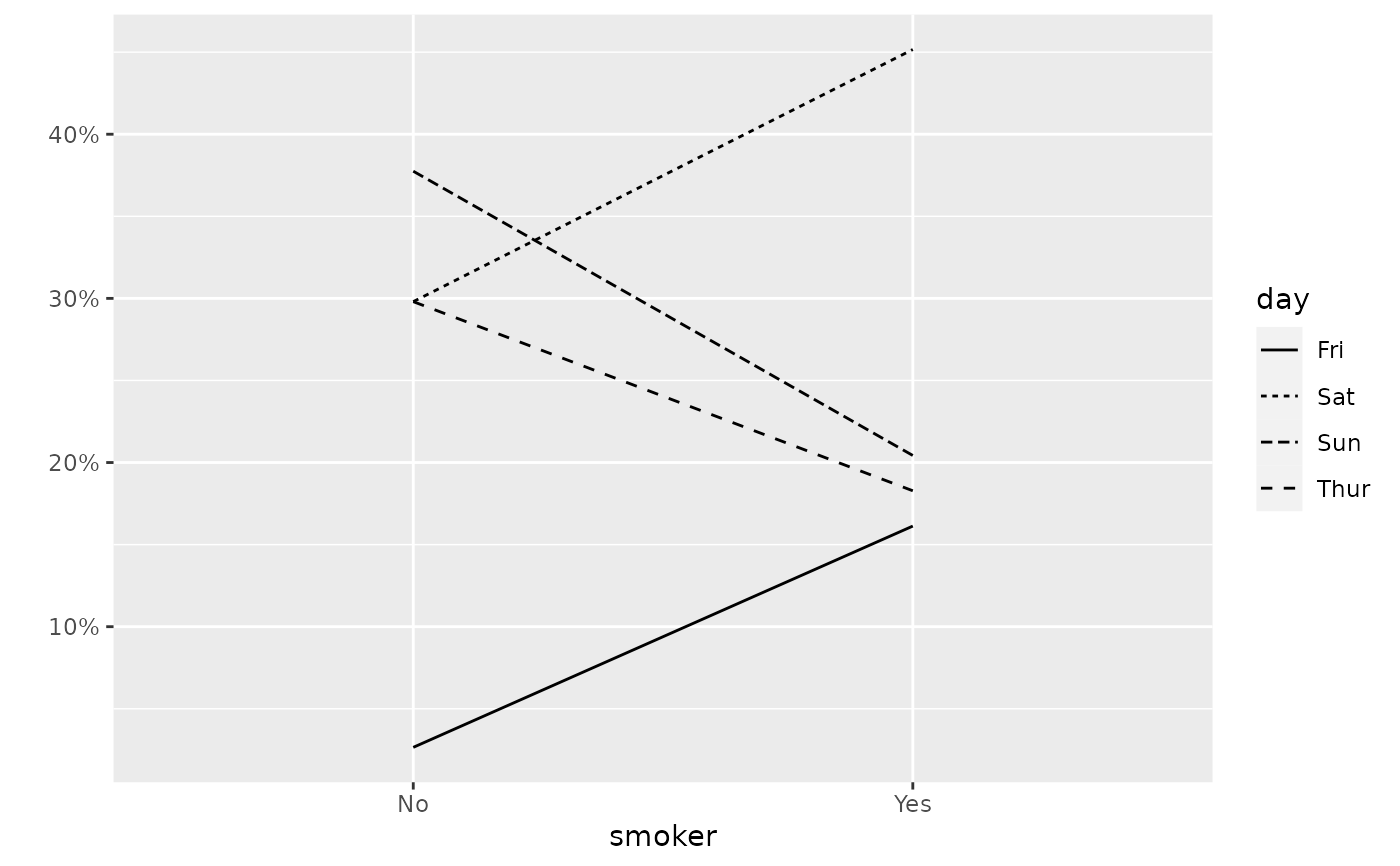
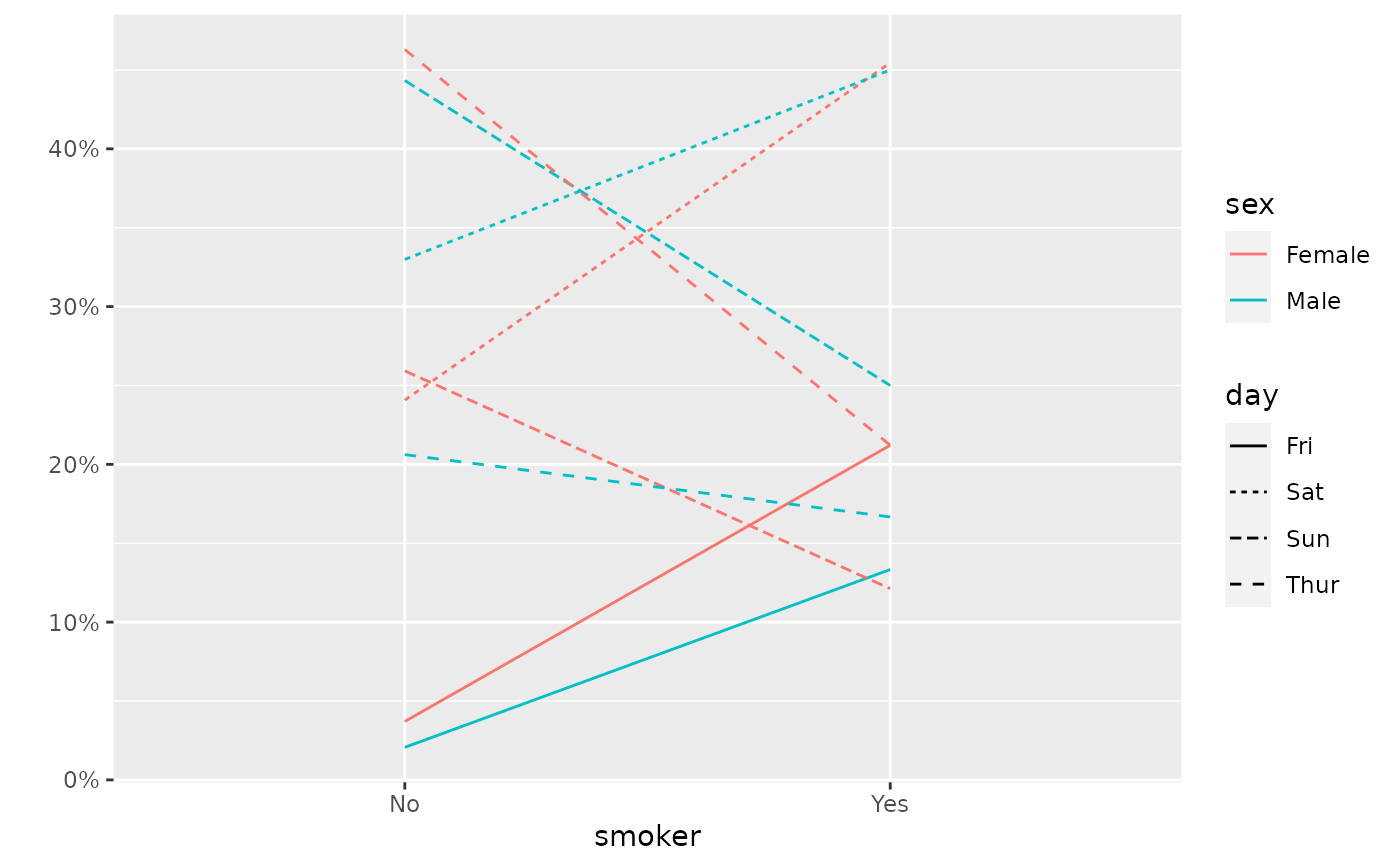
 # Discrete variable with 3 or more categories
p_(ggally_trends(tips_f, mapping = aes(x = smoker, y = day)))
# Discrete variable with 3 or more categories
p_(ggally_trends(tips_f, mapping = aes(x = smoker, y = day)))
 p_(ggally_trends(tips_f, mapping = aes(x = smoker, y = day, color = sex)))
 # Include zero on Y axis
p_(ggally_trends(tips_f, mapping = aes(x = day, y = total_bill), include_zero = TRUE))
# Include zero on Y axis
p_(ggally_trends(tips_f, mapping = aes(x = day, y = total_bill), include_zero = TRUE))
 p_(ggally_trends(tips_f, mapping = aes(x = day, y = smoker), include_zero = TRUE))
 # Change line size
p_(ggally_trends(tips_f, mapping = aes(x = day, y = smoker, colour = sex), size = 3))
# Change line size
p_(ggally_trends(tips_f, mapping = aes(x = day, y = smoker, colour = sex), size = 3))
 # Define weights with the appropriate aesthetic
d <- as.data.frame(Titanic)
p_(ggally_trends(
d,
mapping = aes(x = Class, y = Survived, weight = Freq, color = Sex),
include_zero = TRUE
))
# Define weights with the appropriate aesthetic
d <- as.data.frame(Titanic)
p_(ggally_trends(
d,
mapping = aes(x = Class, y = Survived, weight = Freq, color = Sex),
include_zero = TRUE
))
