This is the function that powers all of the tour animations. If you want to write your own tour animation method, the best place to start is by looking at the code for animation methods that have already implemented in the package.
animate(
  data,
  tour_path = grand_tour(),
  display = display_xy(),
  start = NULL,
  aps = 1,
  fps = 10,
  max_frames = Inf,
  rescale = FALSE,
  sphere = FALSE,
  ...
)
Arguments
- data
matrix, or data frame containing numeric columns
- tour_path
tour path generator, defaults to 2d grand tour
- display
takes the display that is suppose to be used, defaults to the xy display
- start
projection to start at, if not specified, uses default associated with tour path
- aps
target angular velocity (in radians per second)
- fps
target frames per second (defaults to 15, to accommodate RStudio graphics device)
- max_frames
the maximum number of bases to generate. Defaults to Inf for interactive use (must use Ctrl + C to terminate), and 1 for non-interactive use.
- rescale
Default FALSE. If TRUE, rescale all variables to range [0,1]?
- sphere
if true, sphere all variables
- ...
ignored
Value
an (invisible) list of bases visited during this tour
Details
See render to render animations to disk.
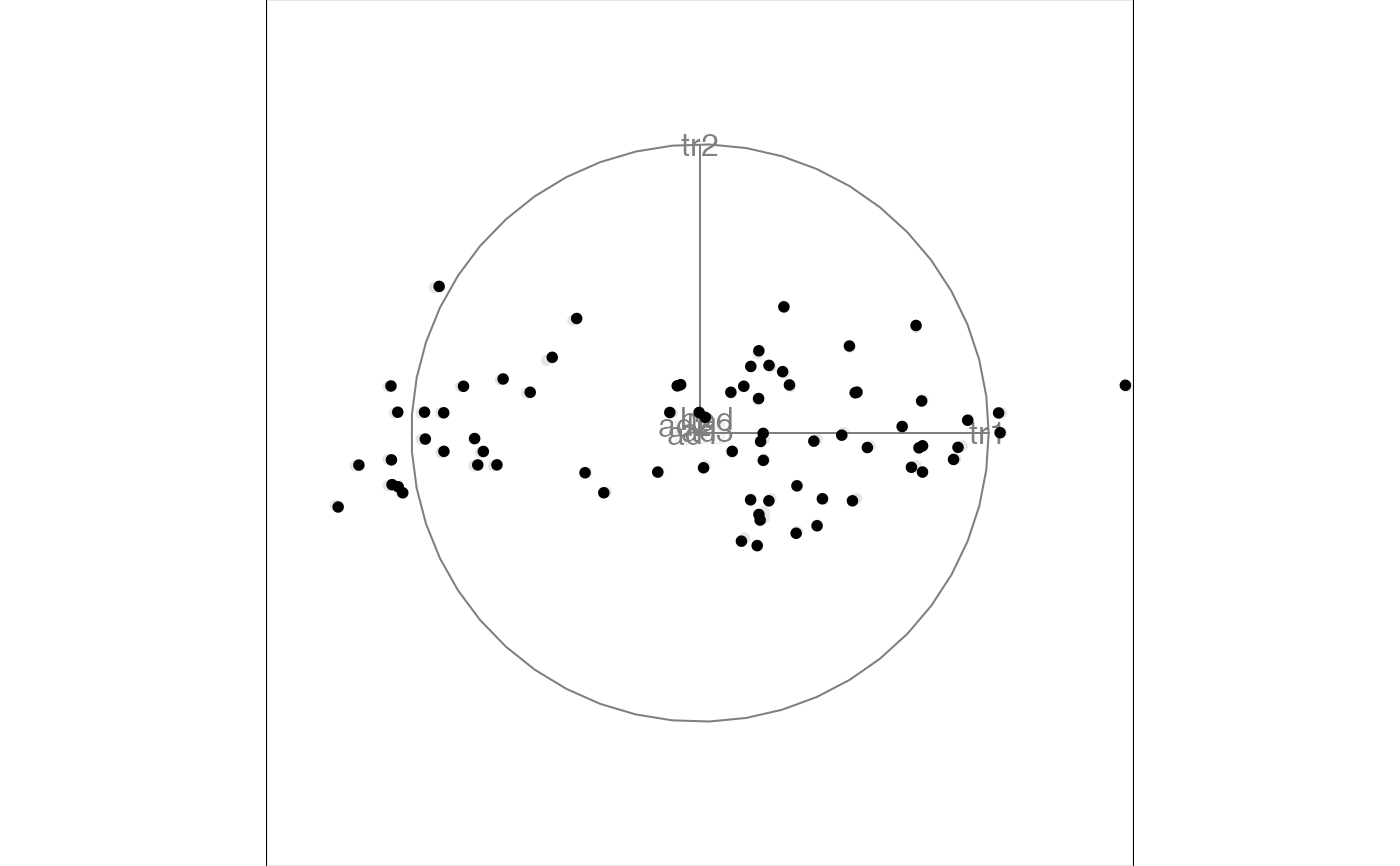
Examples
f <- flea[, 1:6]
animate(f, grand_tour(), display_xy())
#> Converting input data to the required matrix format.
#> Using half_range 4.4
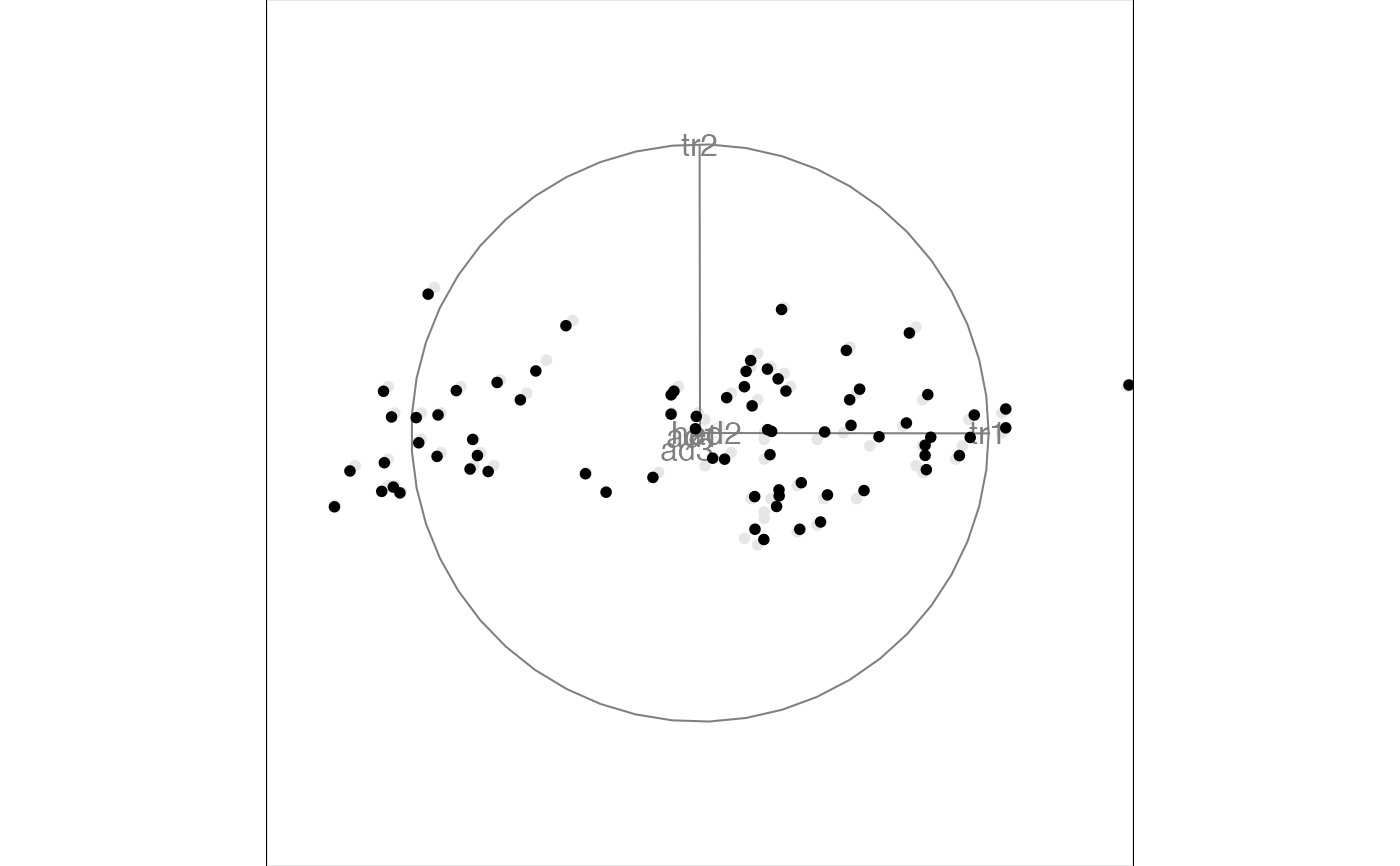 # or in short
animate(f)
#> Converting input data to the required matrix format.
#> Using half_range 4.4
# or in short
animate(f)
#> Converting input data to the required matrix format.
#> Using half_range 4.4
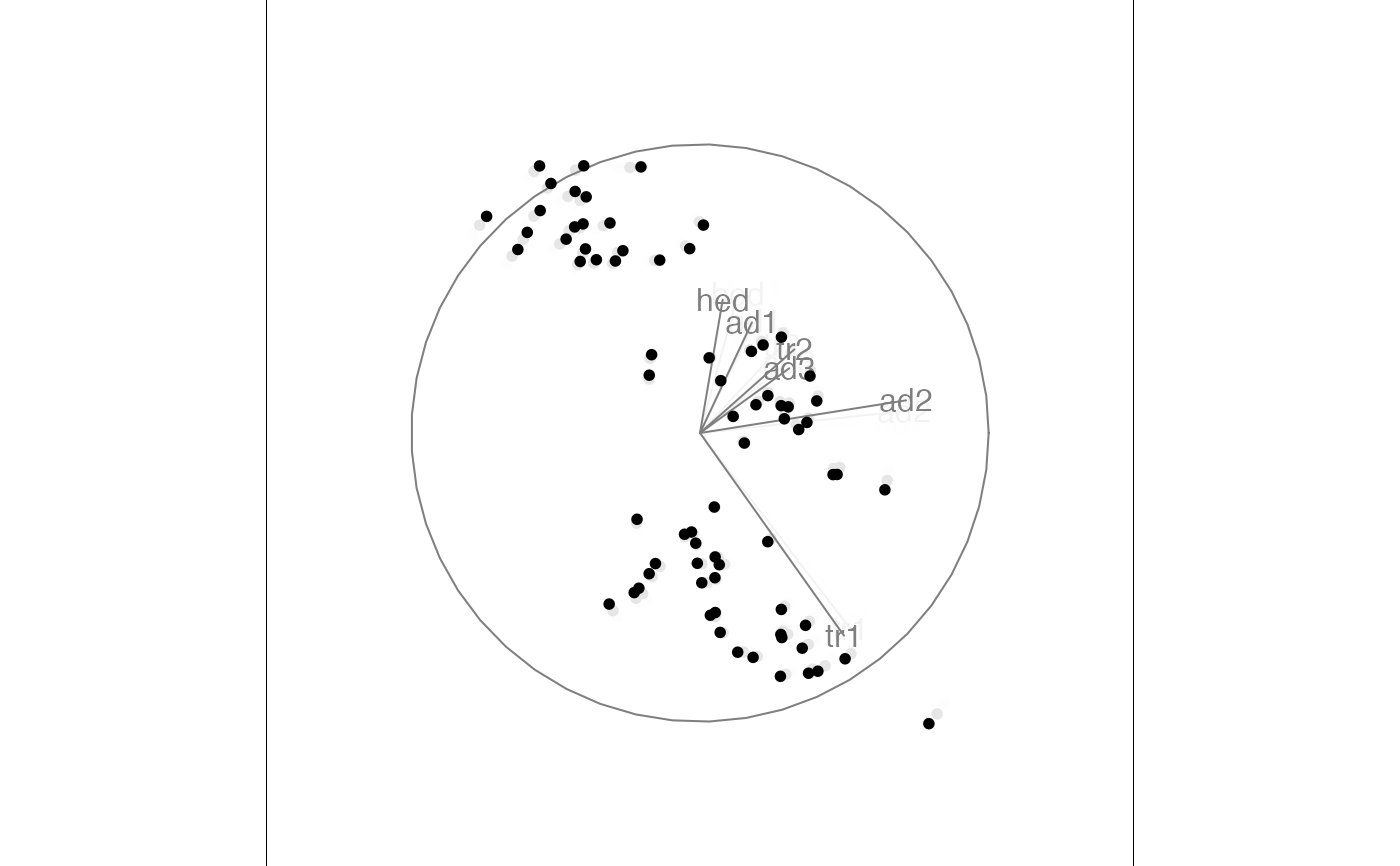
 animate(f, max_frames = 30)
#> Converting input data to the required matrix format.
#> Using half_range 4.4
animate(f, max_frames = 30)
#> Converting input data to the required matrix format.
#> Using half_range 4.4


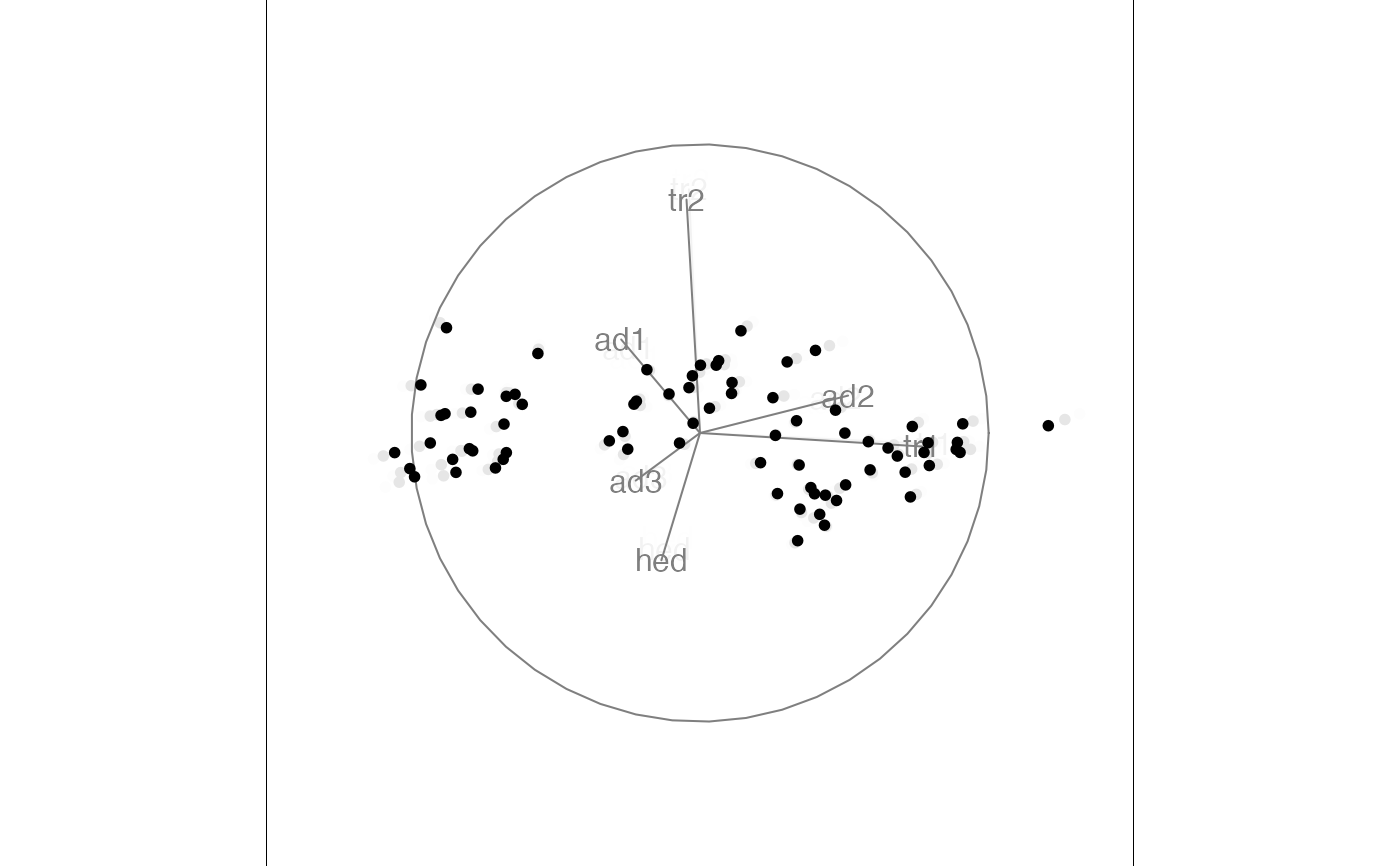
 # \donttest{
animate(f, max_frames = 10, fps = 1, aps = 0.1)
#> Converting input data to the required matrix format.
#> Using half_range 4.4
# \donttest{
animate(f, max_frames = 10, fps = 1, aps = 0.1)
#> Converting input data to the required matrix format.
#> Using half_range 4.4


 # }
# }