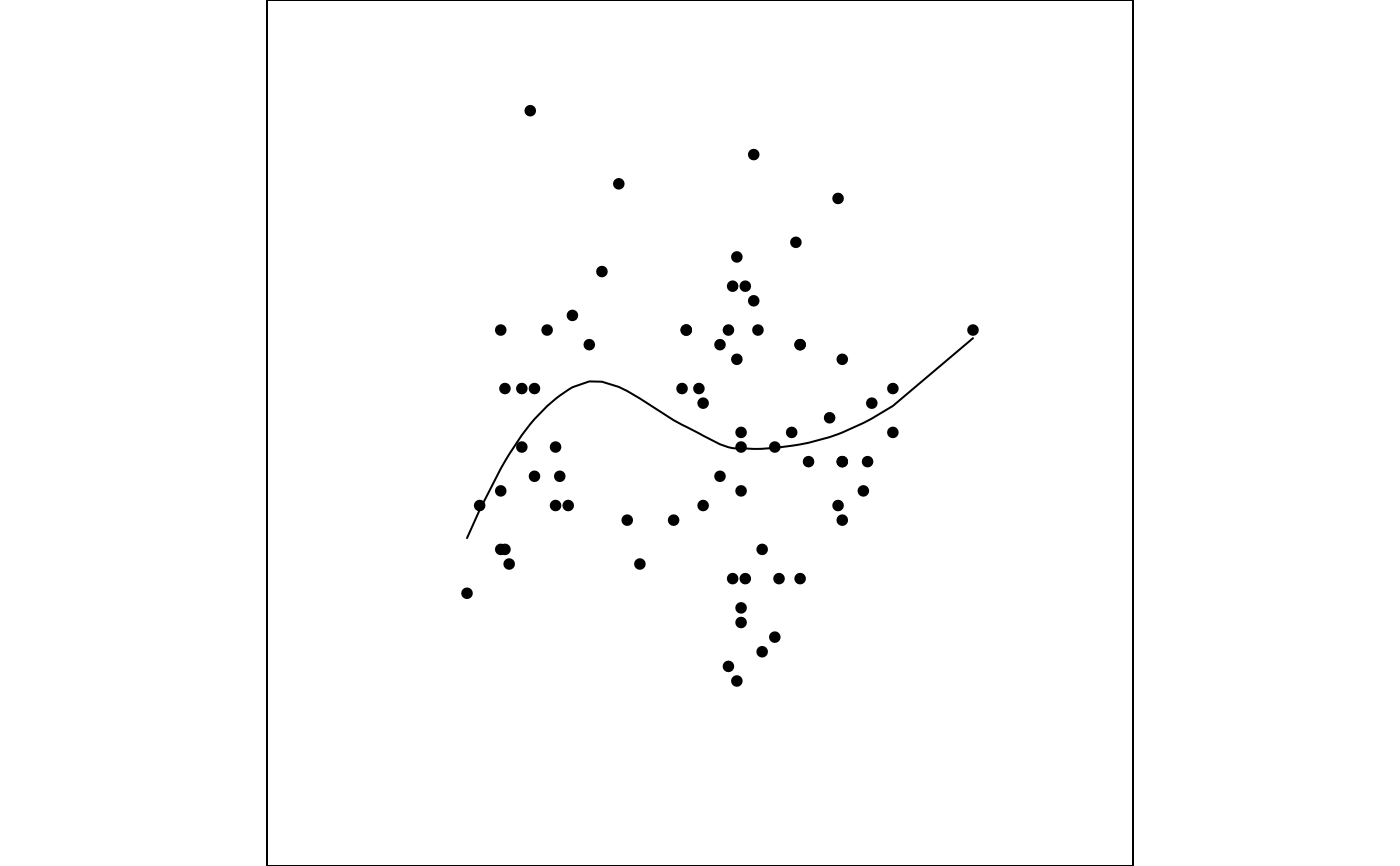
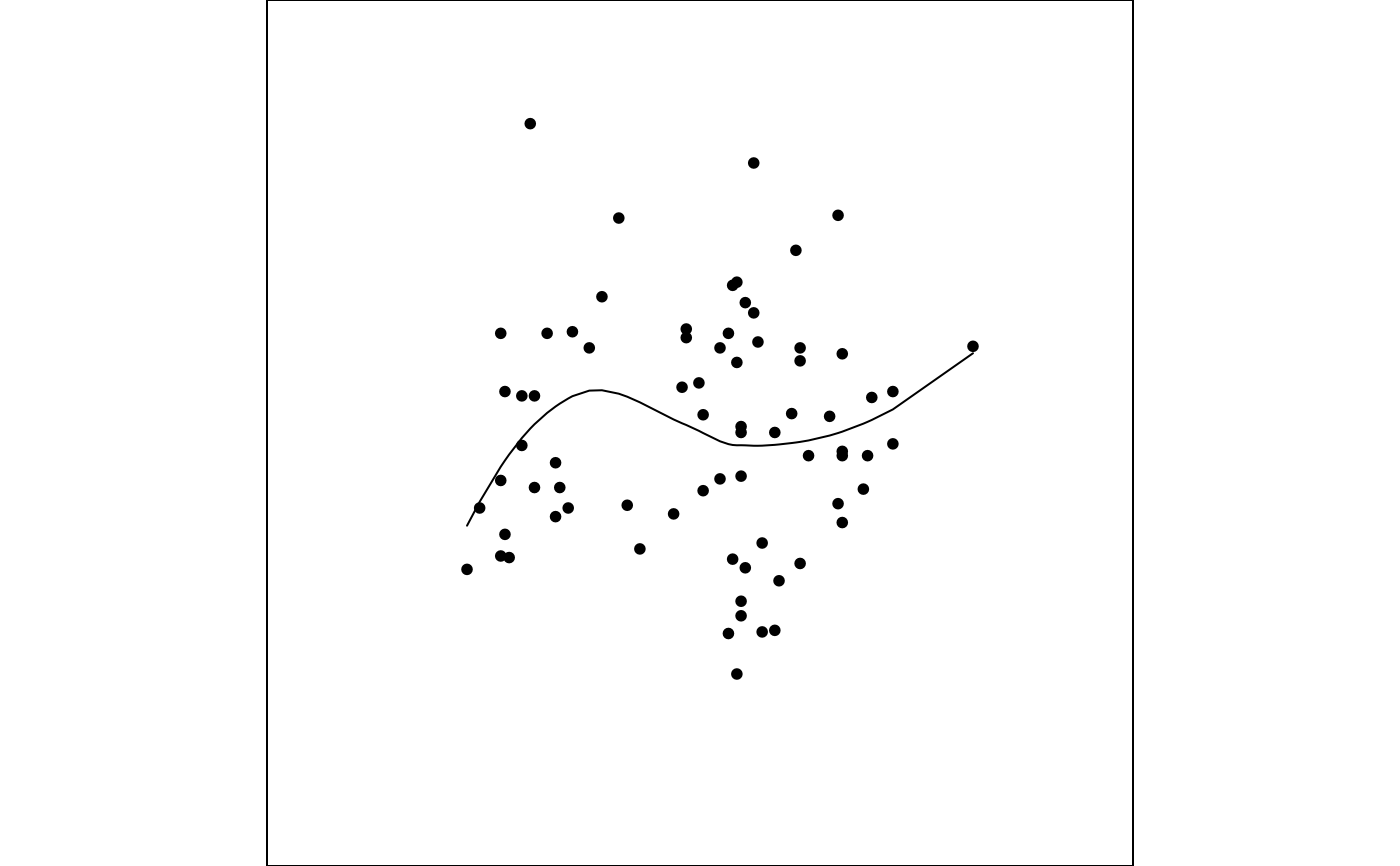
Animate a 2D tour path with a scatterplot.
display_dependence(
  center = TRUE,
  axes = "center",
  half_range = NULL,
  col = "black",
  pch = 20,
  cex = 1,
  edges = NULL,
  edges.col = "black",
  edges.width = 1,
  obs_labels = NULL,
  fit = FALSE,
  palette = "Zissou 1",
  shapeset = c(15:17, 23:25),
  axislablong = FALSE,
  ...
)

animate_dependence(
  data,
  tour_path = dependence_tour(),
  display = display_dependence(),
  ...
)
Arguments
- center
if TRUE, centers projected data to (0,0). This pins the center of data cloud and make it easier to focus on the changing shape rather than position.
- axes
position of the axes: center, bottomleft or off
- half_range
half range to use when calculating limits of projected. If not set, defaults to maximum distance from origin to each row of data.
- col
color to use for points, can be a vector or hexcolors or a factor. Defaults to "black".
- pch
shape of the point to be plotted, can be a factor or integer. Defaults to 20.
- cex
size of the point to be plotted. Defaults to 1.
- edges
A two column integer matrix giving indices of ends of lines.
- edges.col
colour of edges to be plotted, Defaults to "black"
- edges.width
line width for edges, default 1
- obs_labels
vector of text labels to display
- fit
logical indicating where to add a loess line onto plot
- palette
name of color palette for point colour, used by
hcl.colors, default "Zissou 1"- shapeset
numbers corresponding to shapes in base R points, to use for mapping categorical variable to shapes, default=c(15:17, 23:25)
- axislablong
text labels only for the long axes in a projection, default FALSE
- ...
other arguments passed on to
animate- data
matrix, or data frame containing numeric columns
- tour_path
tour path generator, defaults to 2d grand tour
- display
takes the display that is suppose to be used, defaults to the xy display
Examples
animate_dependence(flea[, 1:3],
  dependence_tour(c(1, 2, 2)),
  display_dependence(fit = TRUE, axes = "off"))
#> Converting input data to the required matrix format.
#> Using half_range 3.5