ggally_crosstable is a variation of ggally_table with few modifications: (i) table cells are drawn; (ii) x and y axis are not expanded (and therefore are not aligned with other ggally_* plots); (iii) content and fill of cells can be easily controlled with dedicated arguments.
Examples
# Small function to display plots only if it's interactive
p_ <- GGally::print_if_interactive
data(tips)
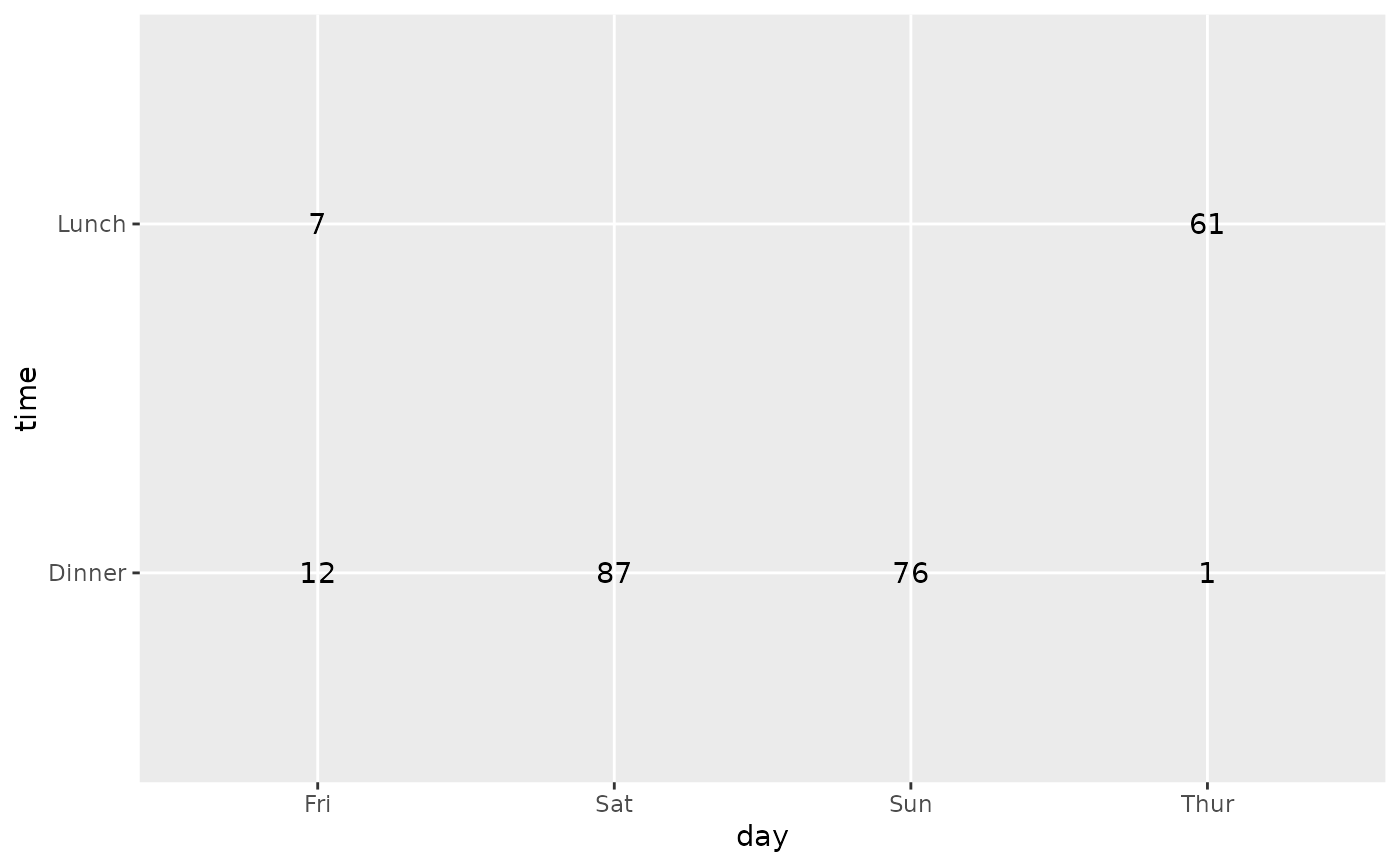
# differences with ggally_table()
p_(ggally_table(tips, mapping = aes(x = day, y = time)))
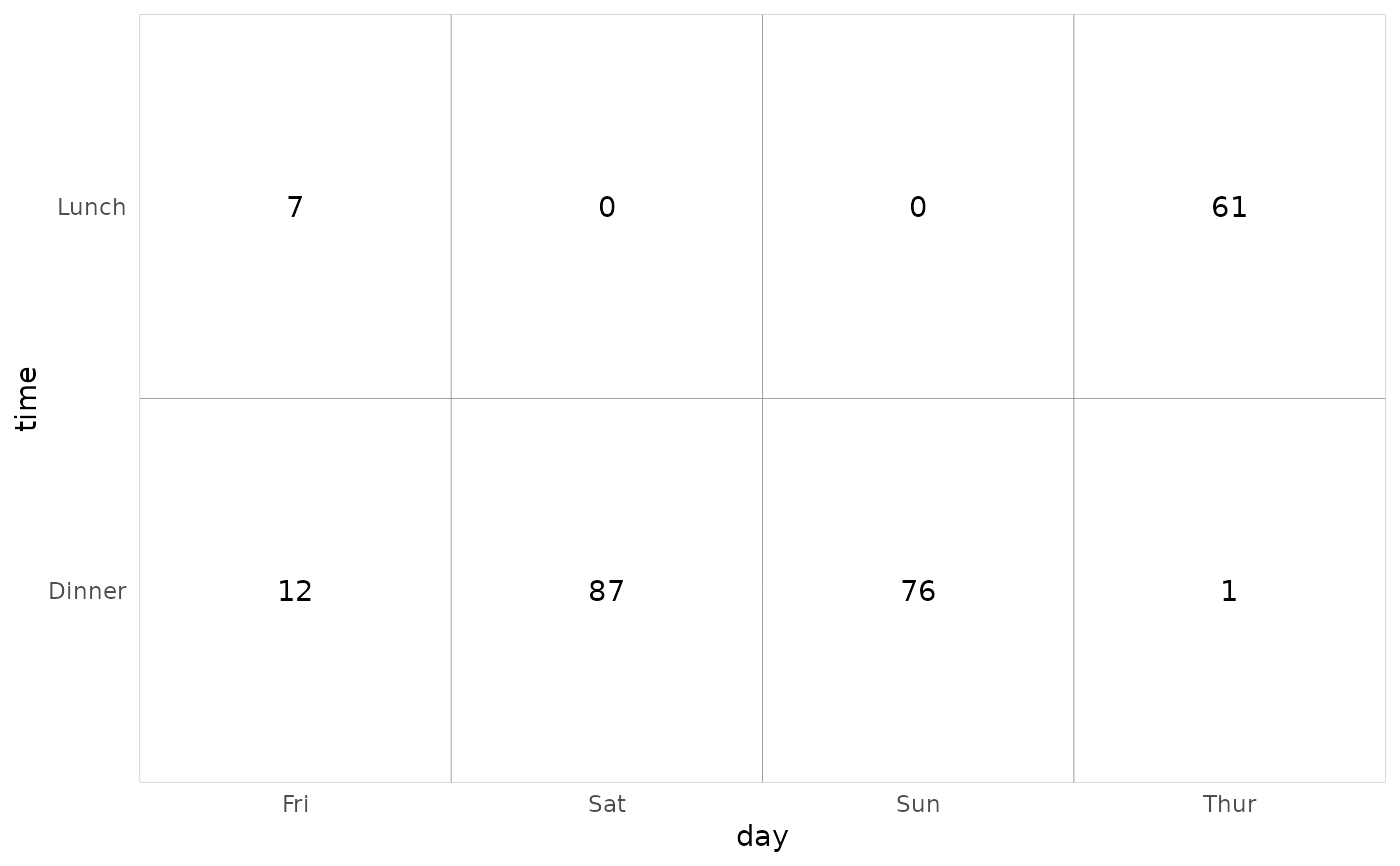
 p_(ggally_crosstable(tips, mapping = aes(x = day, y = time)))
 # display column proportions
p_(ggally_crosstable(tips, mapping = aes(x = day, y = sex), cells = "col.prop"))
# display column proportions
p_(ggally_crosstable(tips, mapping = aes(x = day, y = sex), cells = "col.prop"))
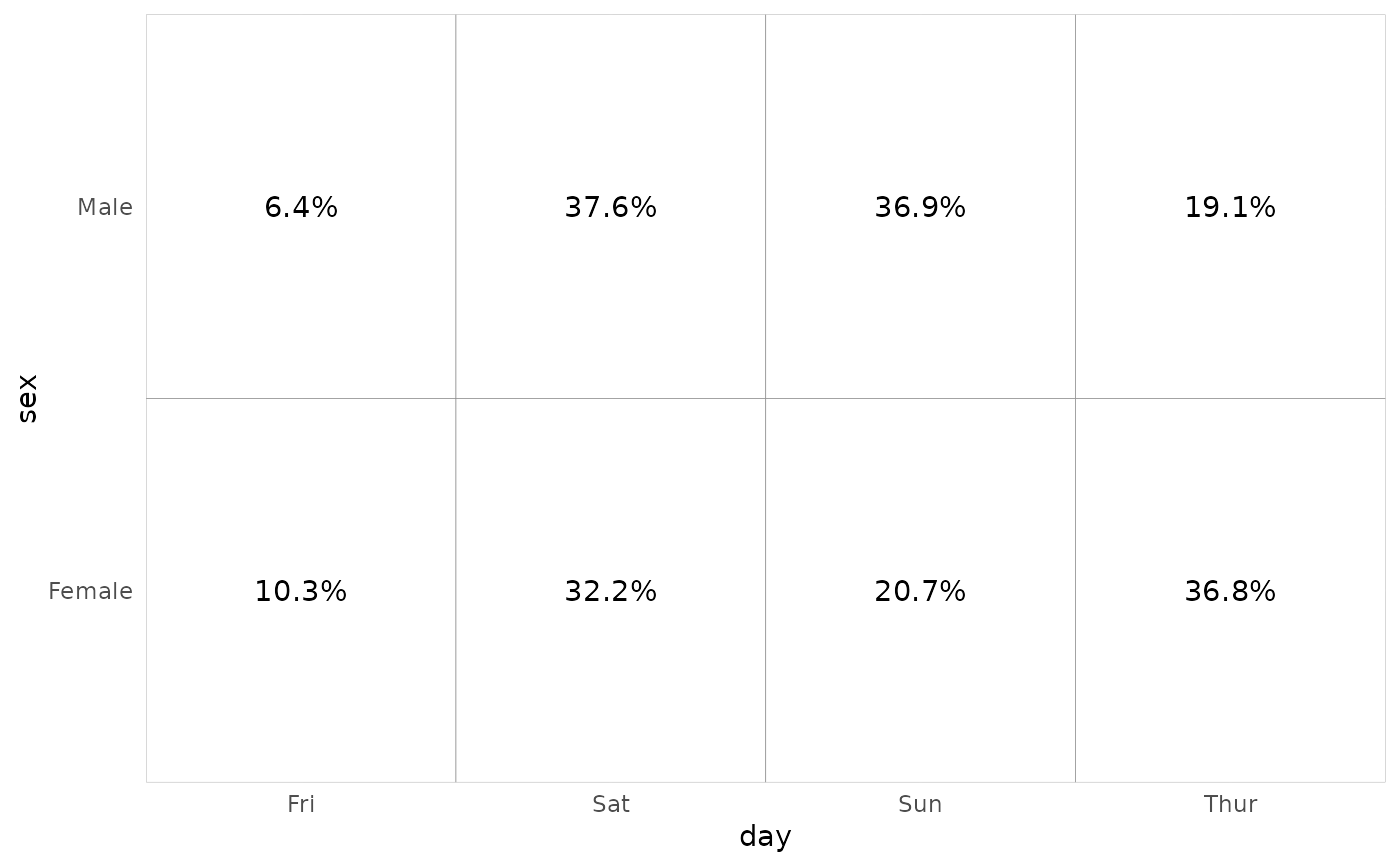
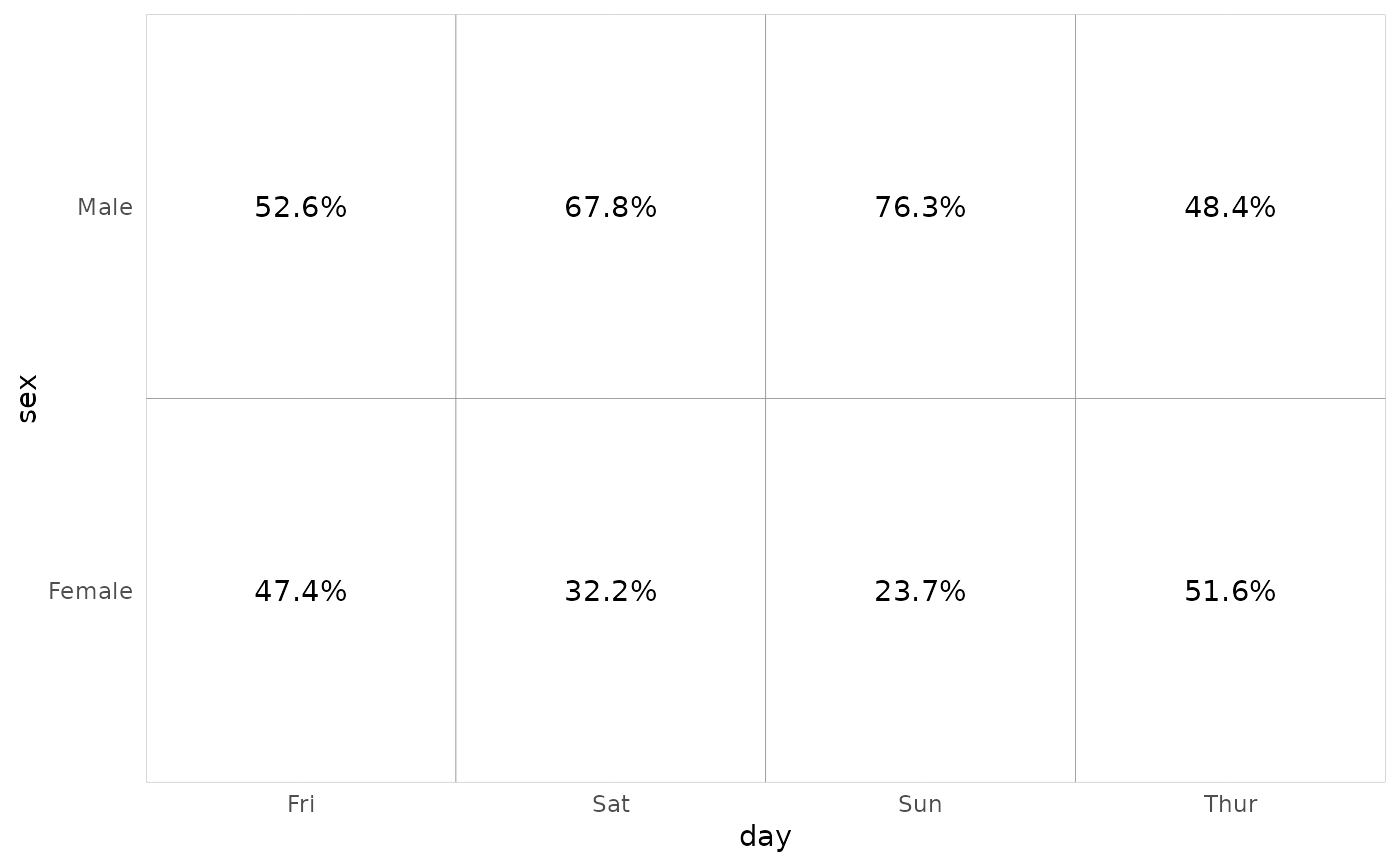 # display row proportions
p_(ggally_crosstable(tips, mapping = aes(x = day, y = sex), cells = "row.prop"))
# display row proportions
p_(ggally_crosstable(tips, mapping = aes(x = day, y = sex), cells = "row.prop"))
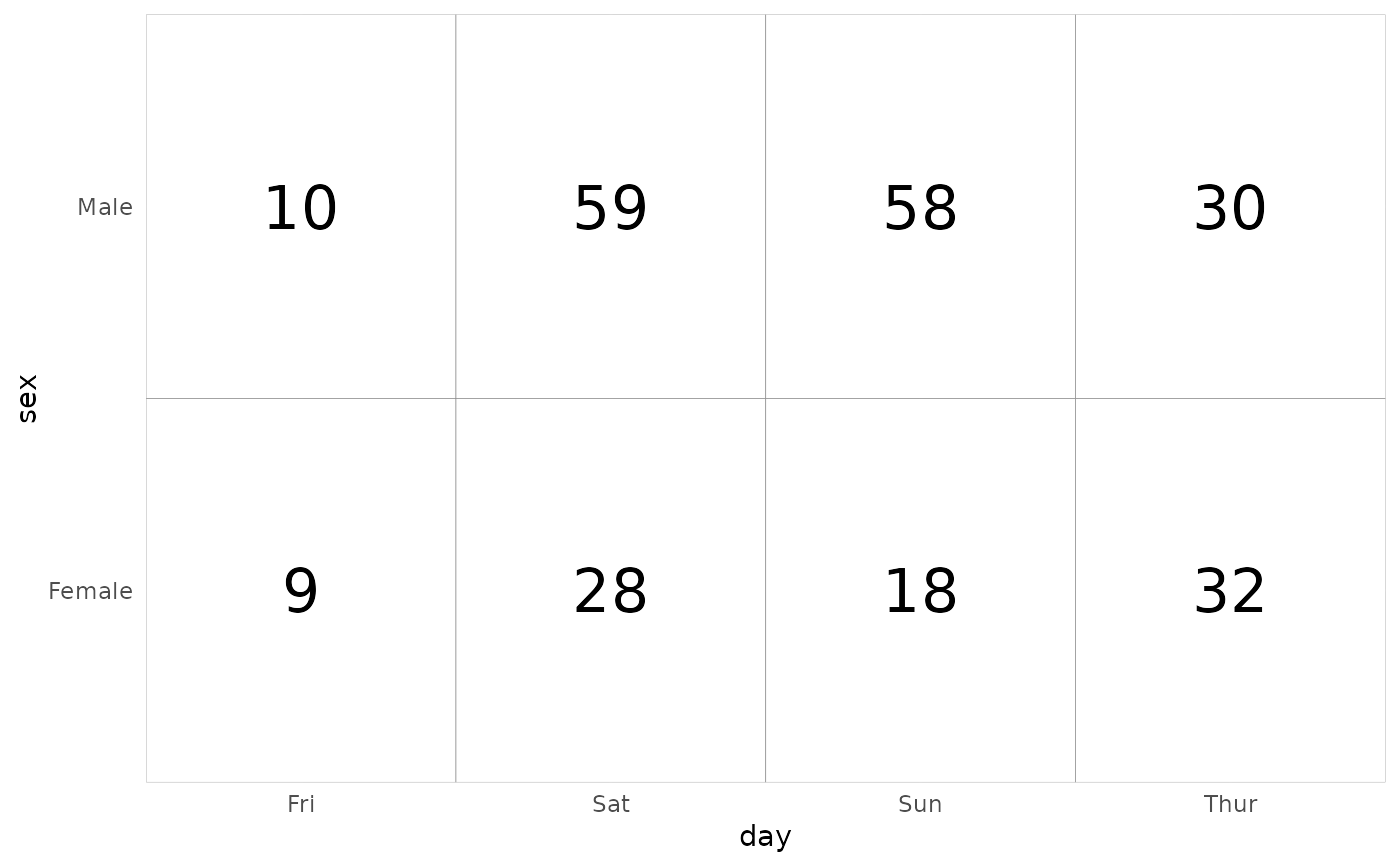
 # change size of text
p_(ggally_crosstable(tips, mapping = aes(x = day, y = sex), size = 8))
# change size of text
p_(ggally_crosstable(tips, mapping = aes(x = day, y = sex), size = 8))
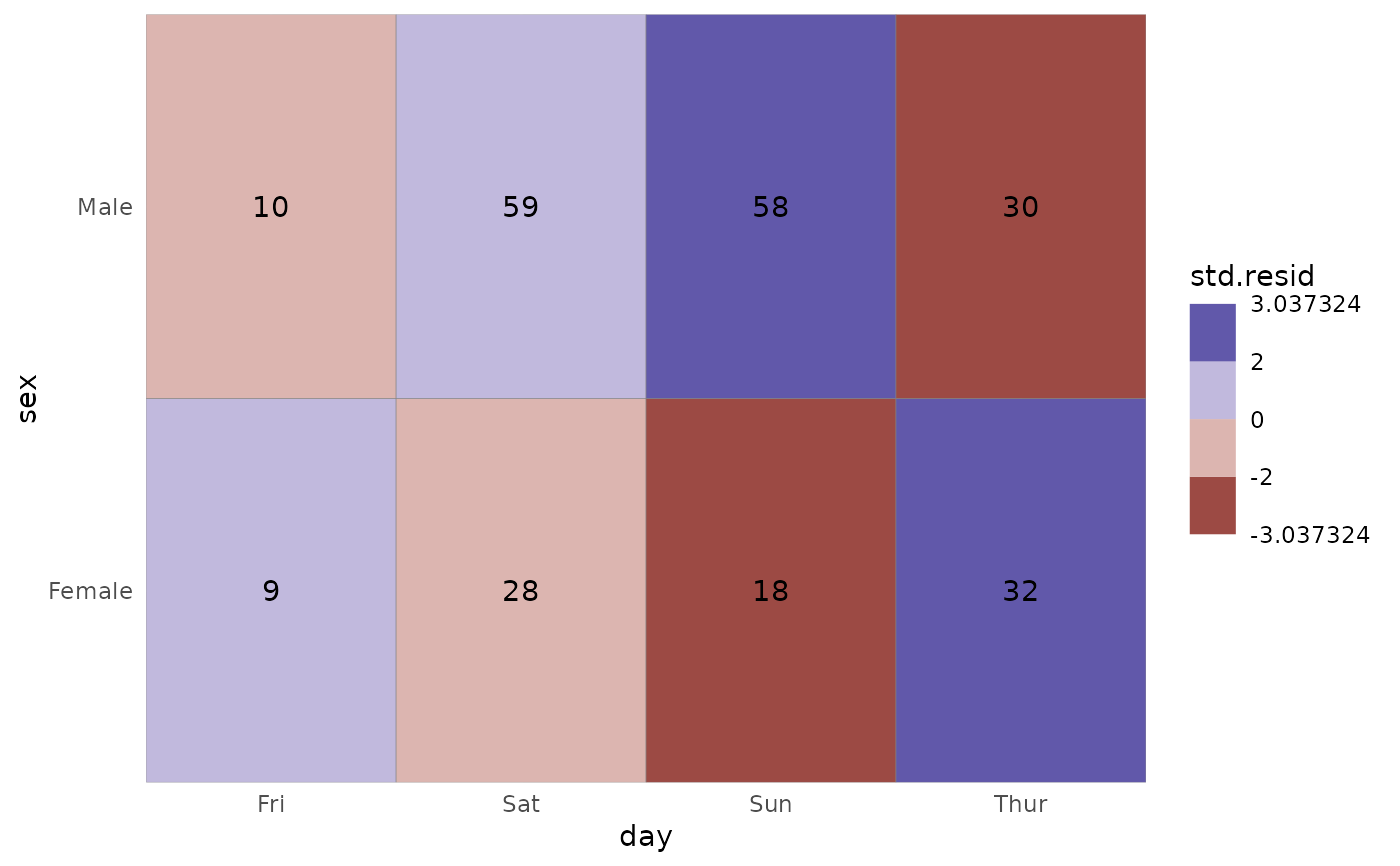
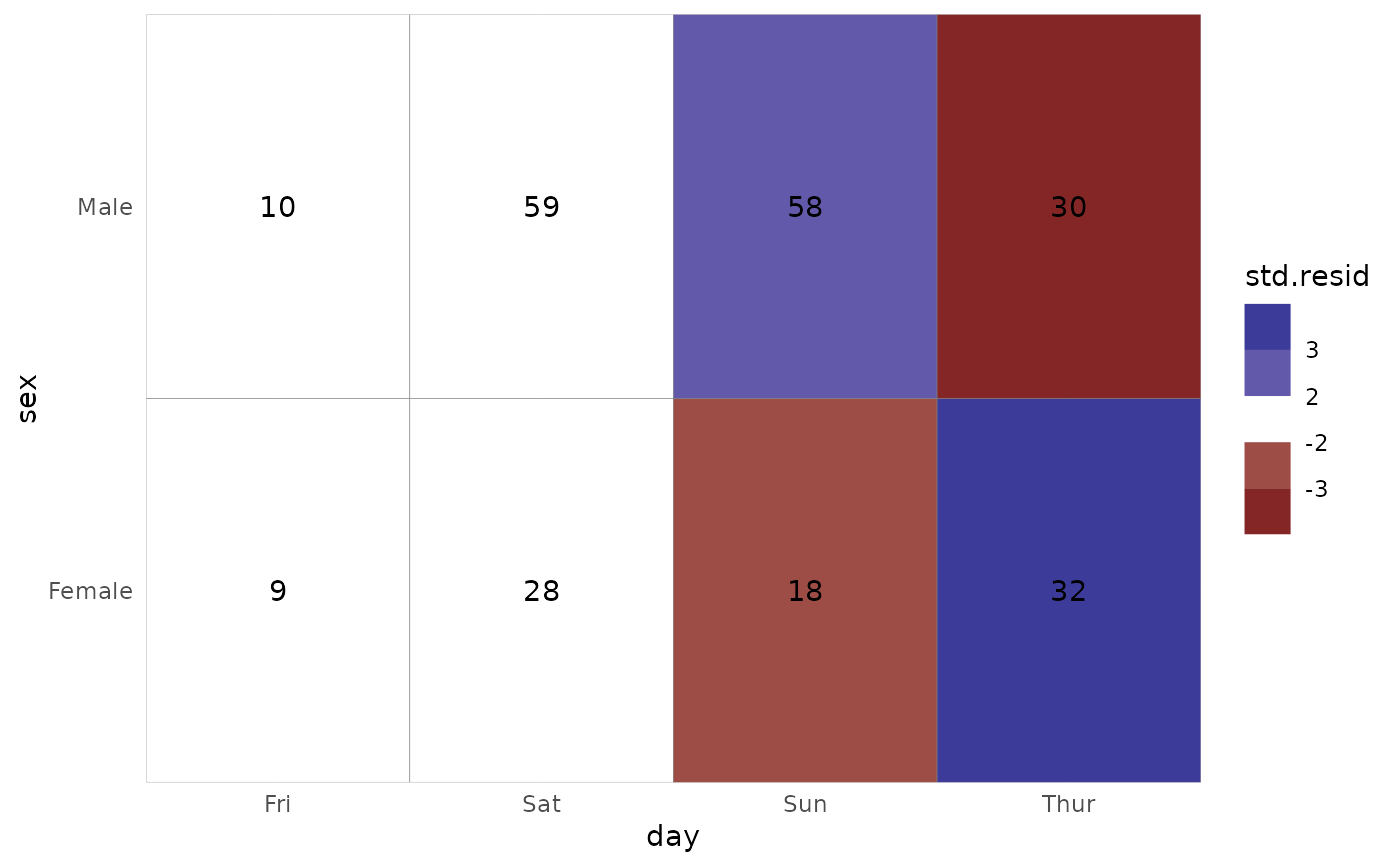
 # fill cells with standardized residuals
p_(ggally_crosstable(tips, mapping = aes(x = day, y = sex), fill = "std.resid"))
# fill cells with standardized residuals
p_(ggally_crosstable(tips, mapping = aes(x = day, y = sex), fill = "std.resid"))
 # change scale for fill
p_(ggally_crosstable(tips, mapping = aes(x = day, y = sex), fill = "std.resid") +
scale_fill_steps2(breaks = c(-2, 0, 2), show.limits = TRUE))
#> Scale for fill is already present.
#> Adding another scale for fill, which will replace the existing scale.
# change scale for fill
p_(ggally_crosstable(tips, mapping = aes(x = day, y = sex), fill = "std.resid") +
scale_fill_steps2(breaks = c(-2, 0, 2), show.limits = TRUE))
#> Scale for fill is already present.
#> Adding another scale for fill, which will replace the existing scale.