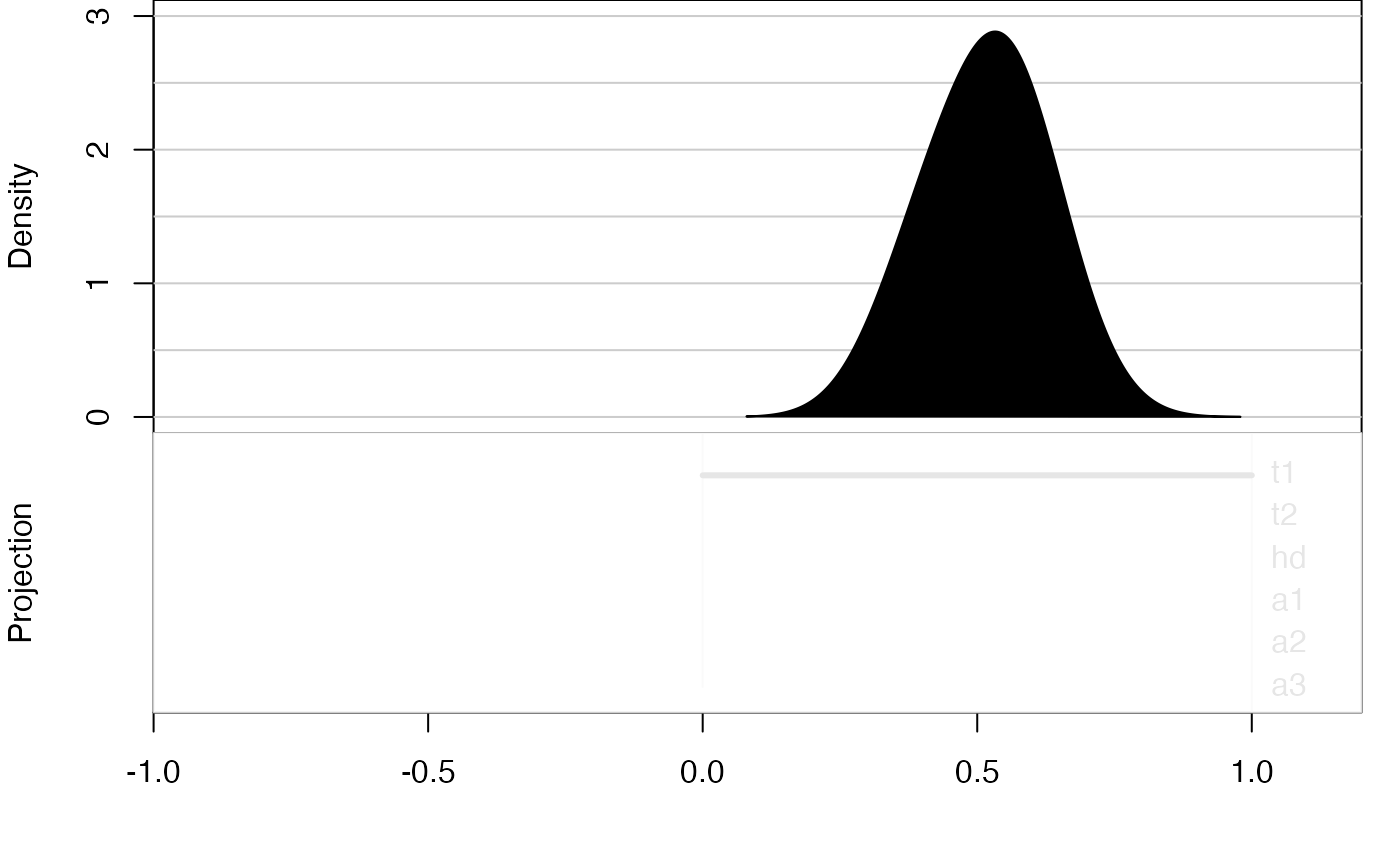
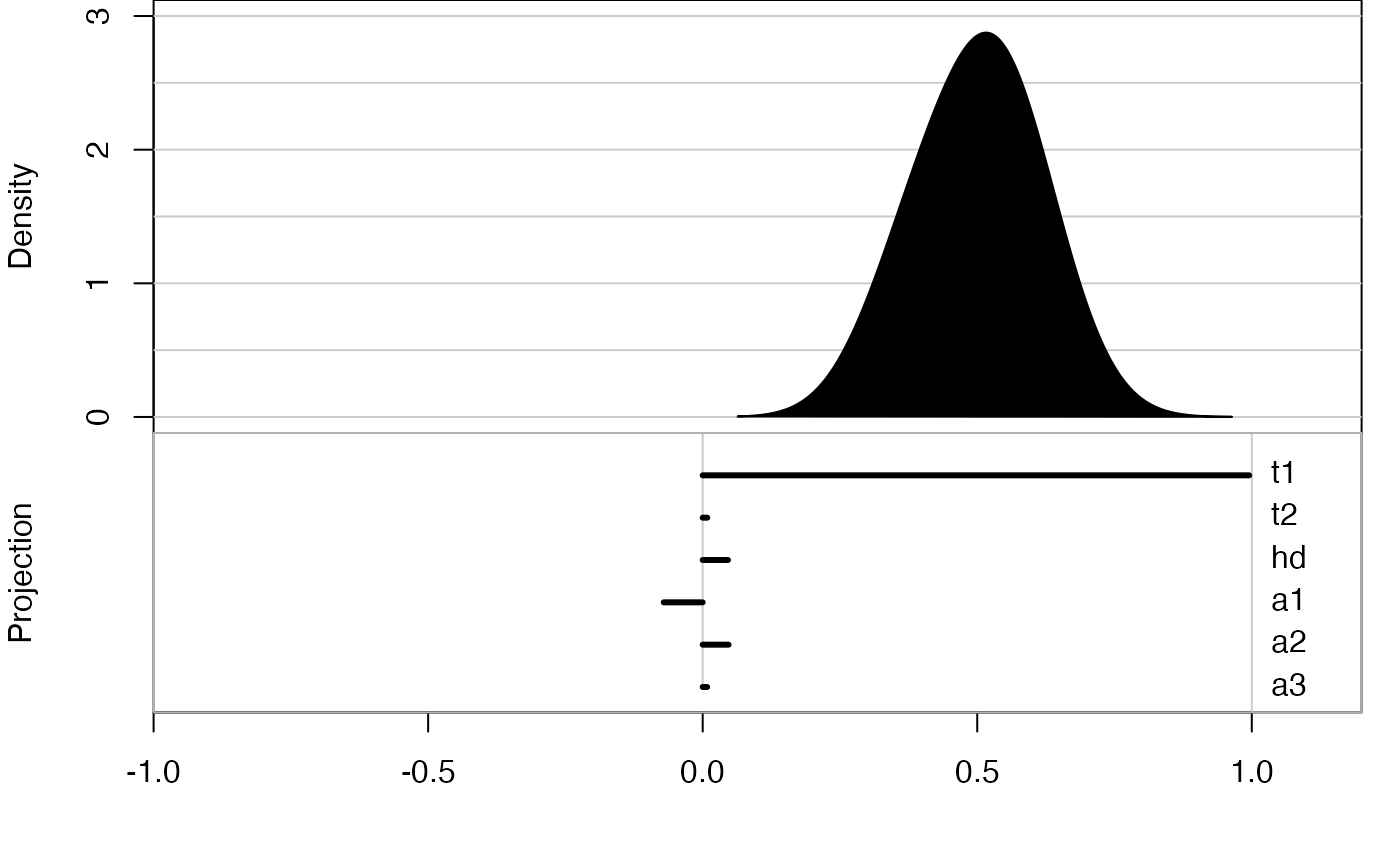
Animate a 1d tour path with a density plot or histogram.
display_dist(
  method = "density",
  center = TRUE,
  half_range = NULL,
  col = "black",
  rug = FALSE,
  palette = "Zissou 1",
  density_max = 3,
  bw = 0.2,
  scale_density = FALSE,
  ...
)

animate_dist(data, tour_path = grand_tour(1), ...)
Arguments
- method
display method, histogram or density plot
- center
should 1d projection be centered to have mean zero (default: TRUE). This pins the centre of distribution to the same place, and makes it easier to focus on the shape of the distribution.
- half_range
half range to use when calculating limits of projected. If not set, defaults to maximum distance from origin to each row of data.
- col
color to use for points, can be a vector or hexcolors or a factor. Defaults to "black".
- rug
draw rug plot showing position of actual data points?
- palette
name of color palette for point colour, used by
hcl.colors, default "Zissou 1"- density_max
allow control of the y range for density plot
- bw
binwidth for histogram and density, between 0-1, default 0.2
- scale_density
Height of density is scaled at each projection, default FALSE
- ...
other arguments passed on to
animate- data
matrix, or data frame containing numeric columns
- tour_path
tour path generator, defaults to 2d grand tour
See also
animate for options that apply to all animations
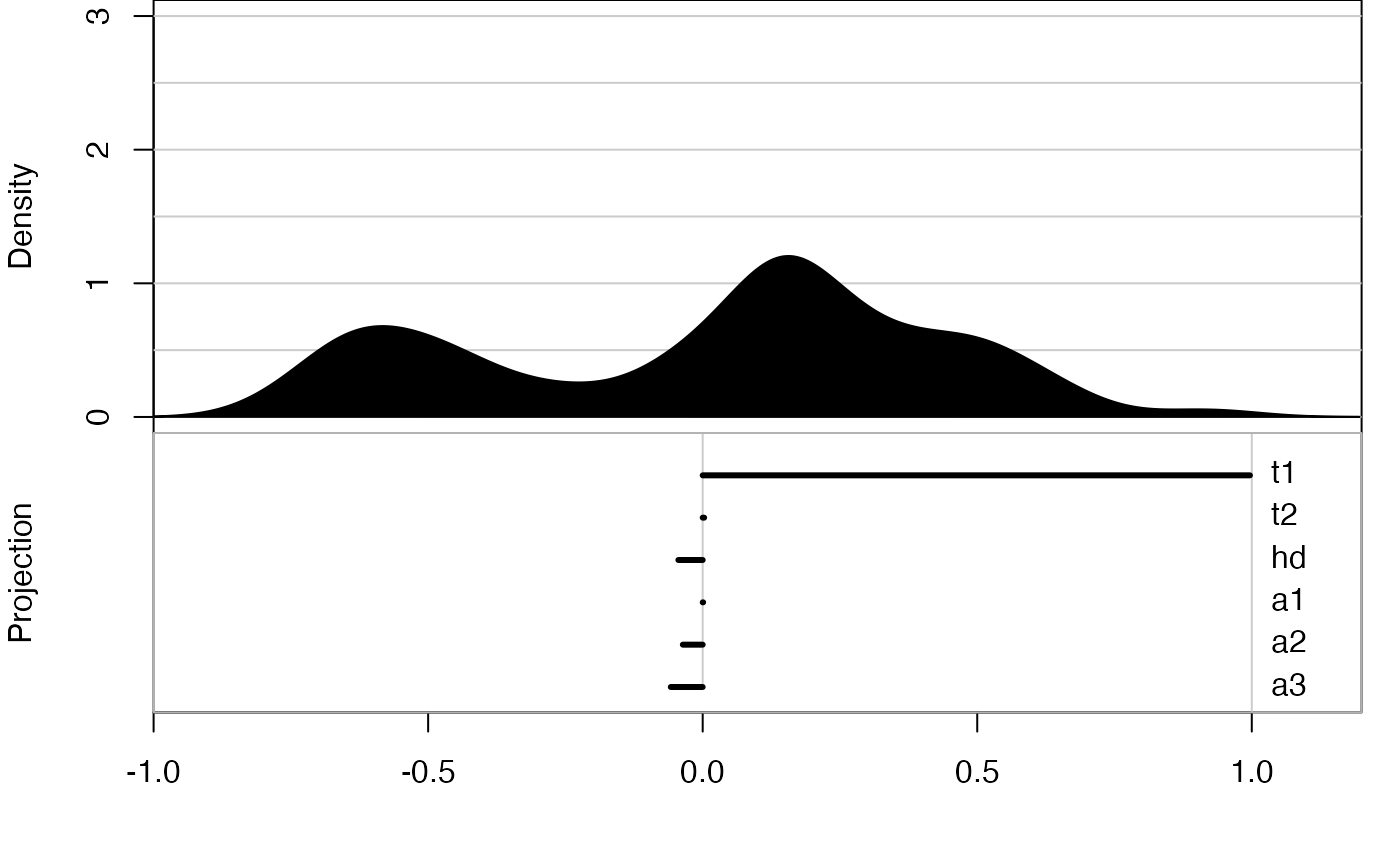
Examples
animate_dist(flea[, 1:6])
#> Converting input data to the required matrix format.
#> Using half_range 4.4
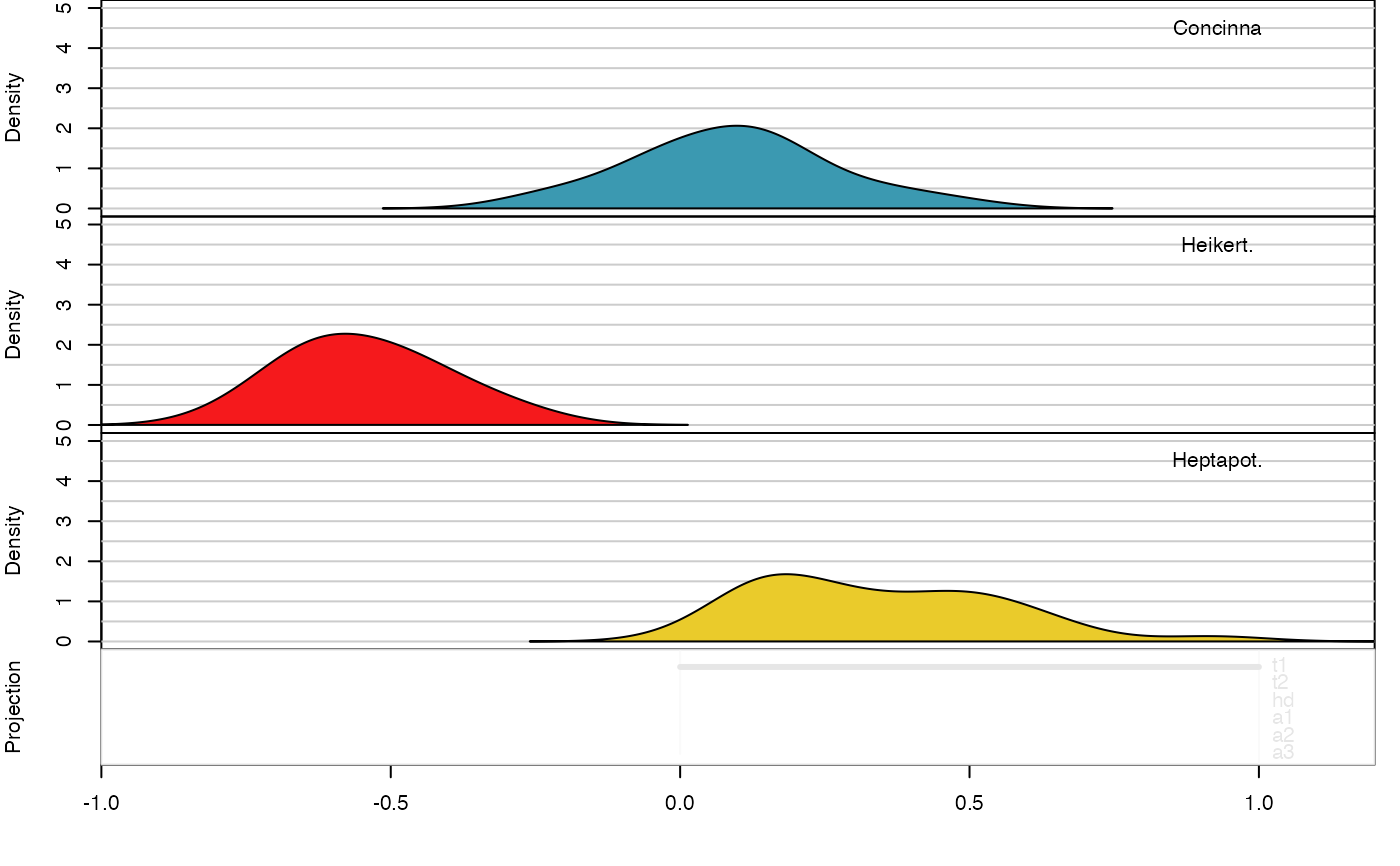
 # Change inputs, to color by group, fix y axis, change bin width
# and scale bar height or density at each projection
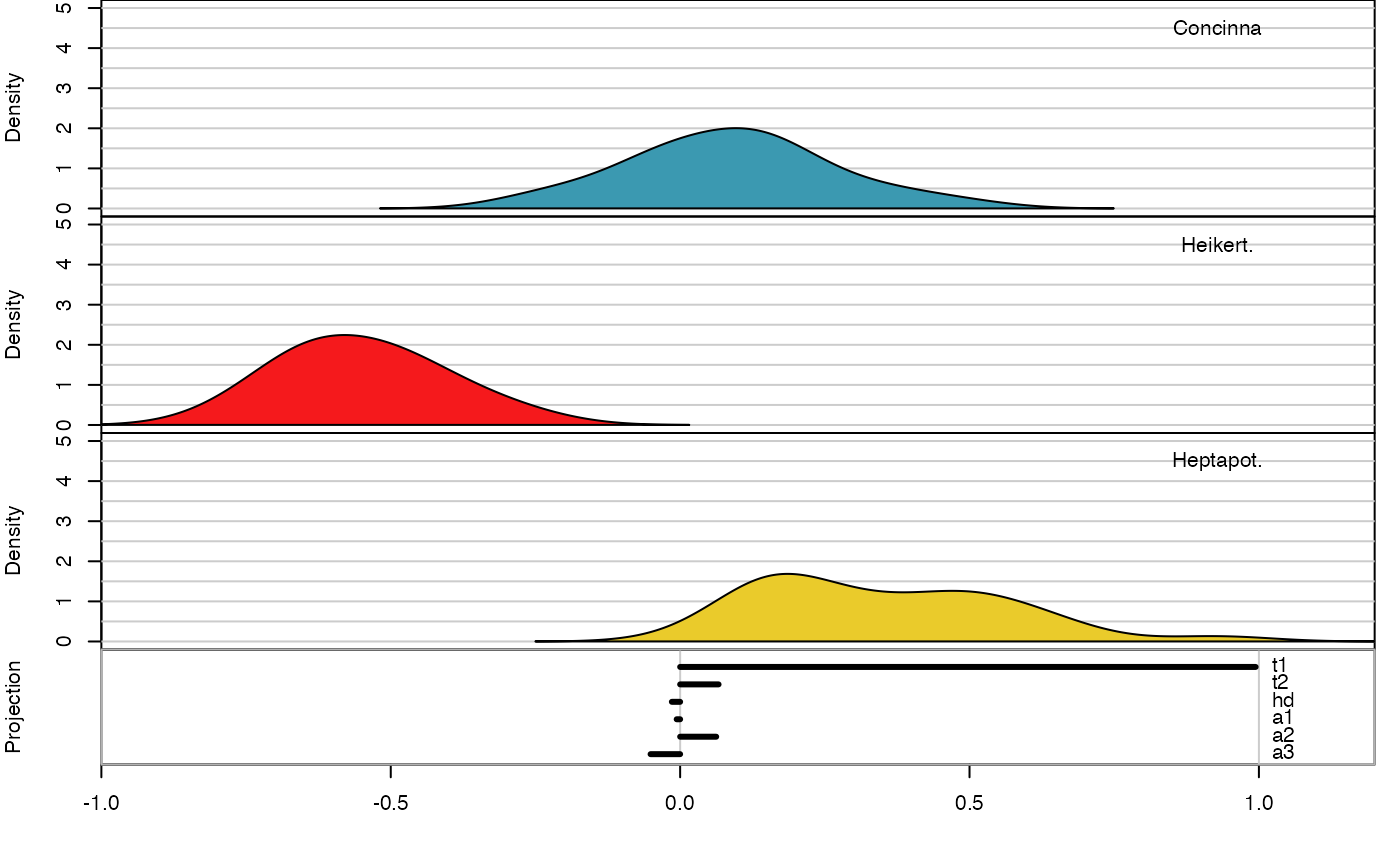
animate_dist(flea[, 1:6], col=flea$species, density_max=5)
#> Converting input data to the required matrix format.
#> Using half_range 4.4
# Change inputs, to color by group, fix y axis, change bin width
# and scale bar height or density at each projection
animate_dist(flea[, 1:6], col=flea$species, density_max=5)
#> Converting input data to the required matrix format.
#> Using half_range 4.4
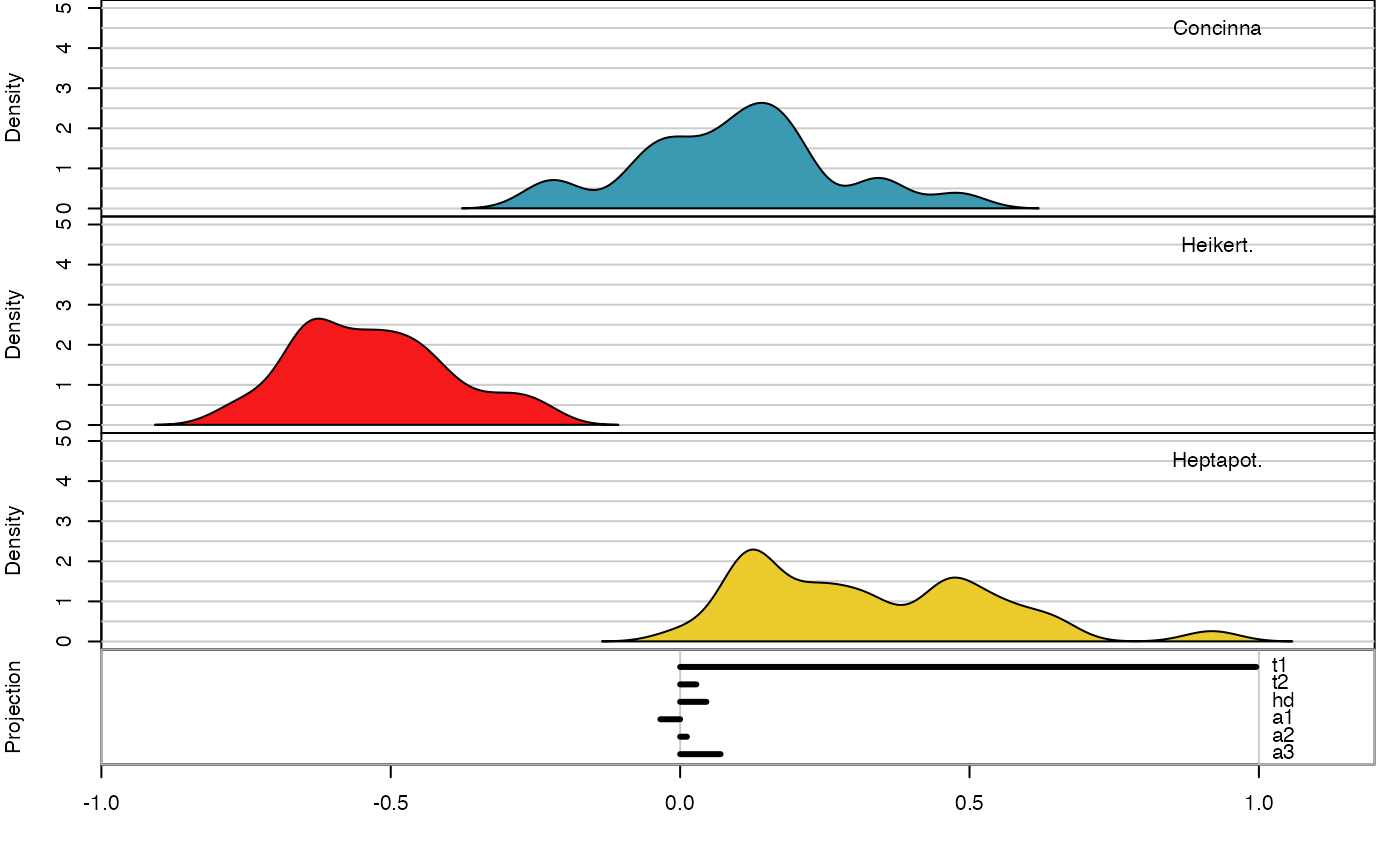
 animate_dist(flea[, 1:6], col=flea$species, density_max=5, bw=0.1)
#> Converting input data to the required matrix format.
#> Using half_range 4.4
animate_dist(flea[, 1:6], col=flea$species, density_max=5, bw=0.1)
#> Converting input data to the required matrix format.
#> Using half_range 4.4

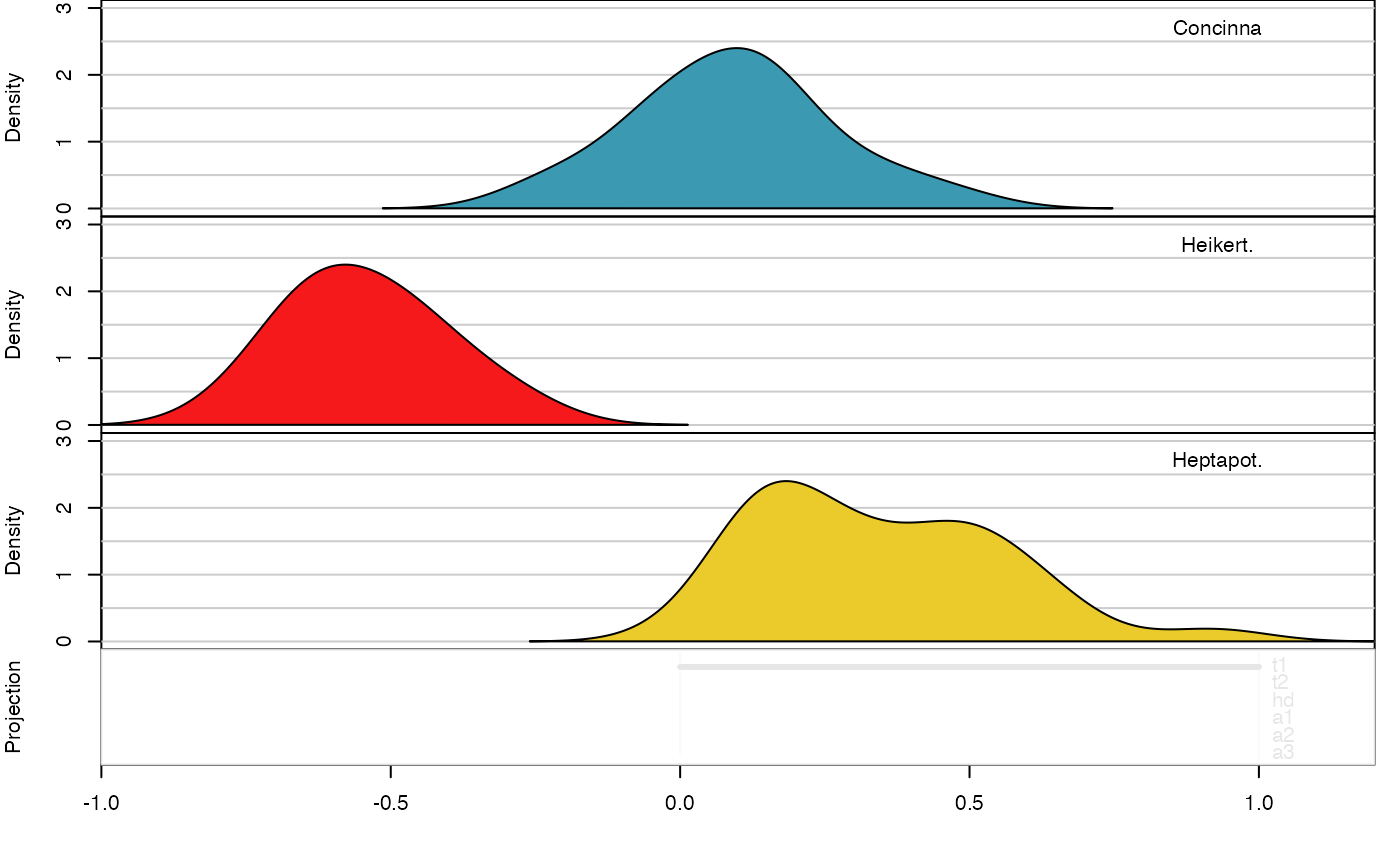
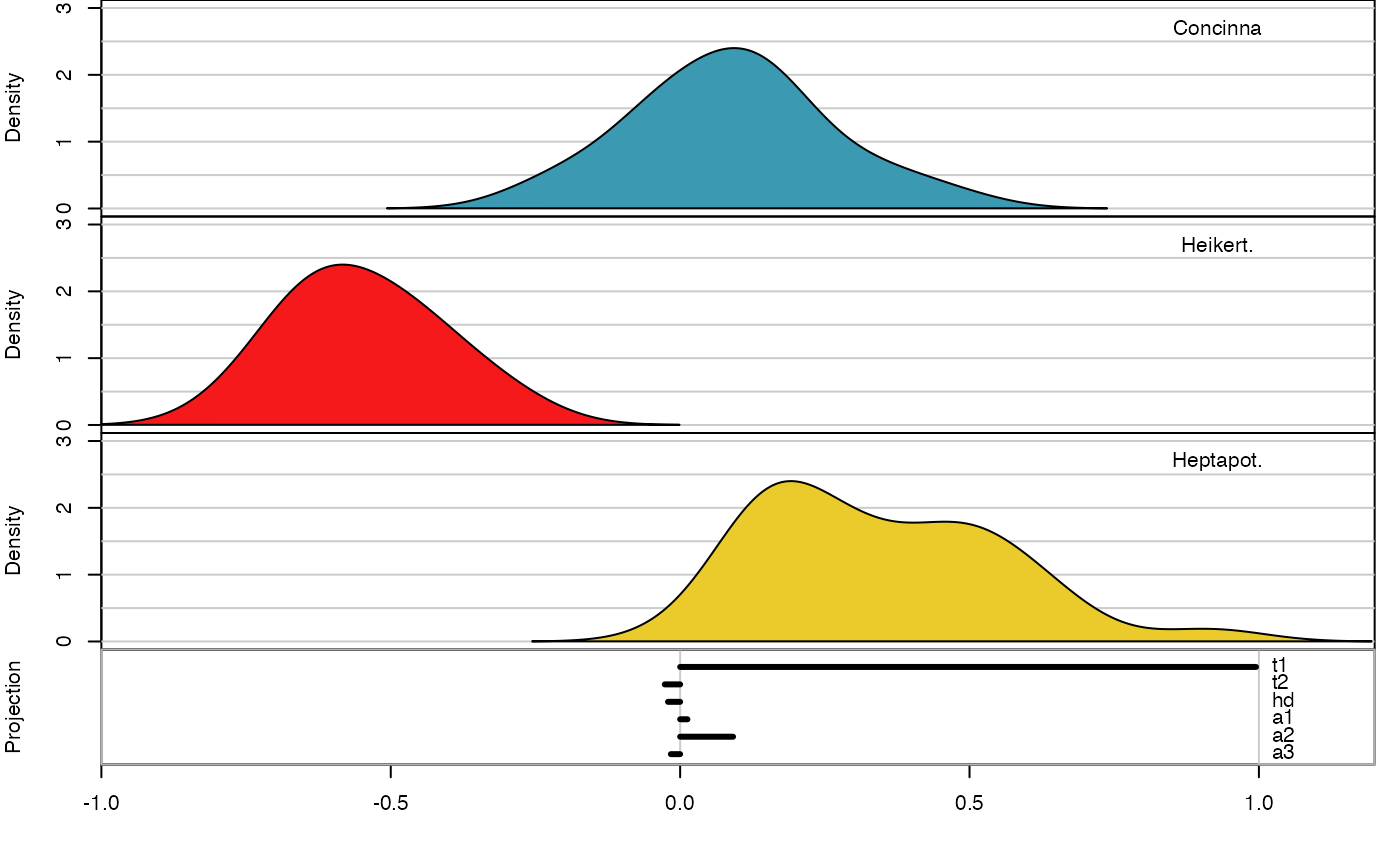
 animate_dist(flea[, 1:6], col=flea$species, scale_density=TRUE)
#> Converting input data to the required matrix format.
#> Using half_range 4.4
animate_dist(flea[, 1:6], col=flea$species, scale_density=TRUE)
#> Converting input data to the required matrix format.
#> Using half_range 4.4
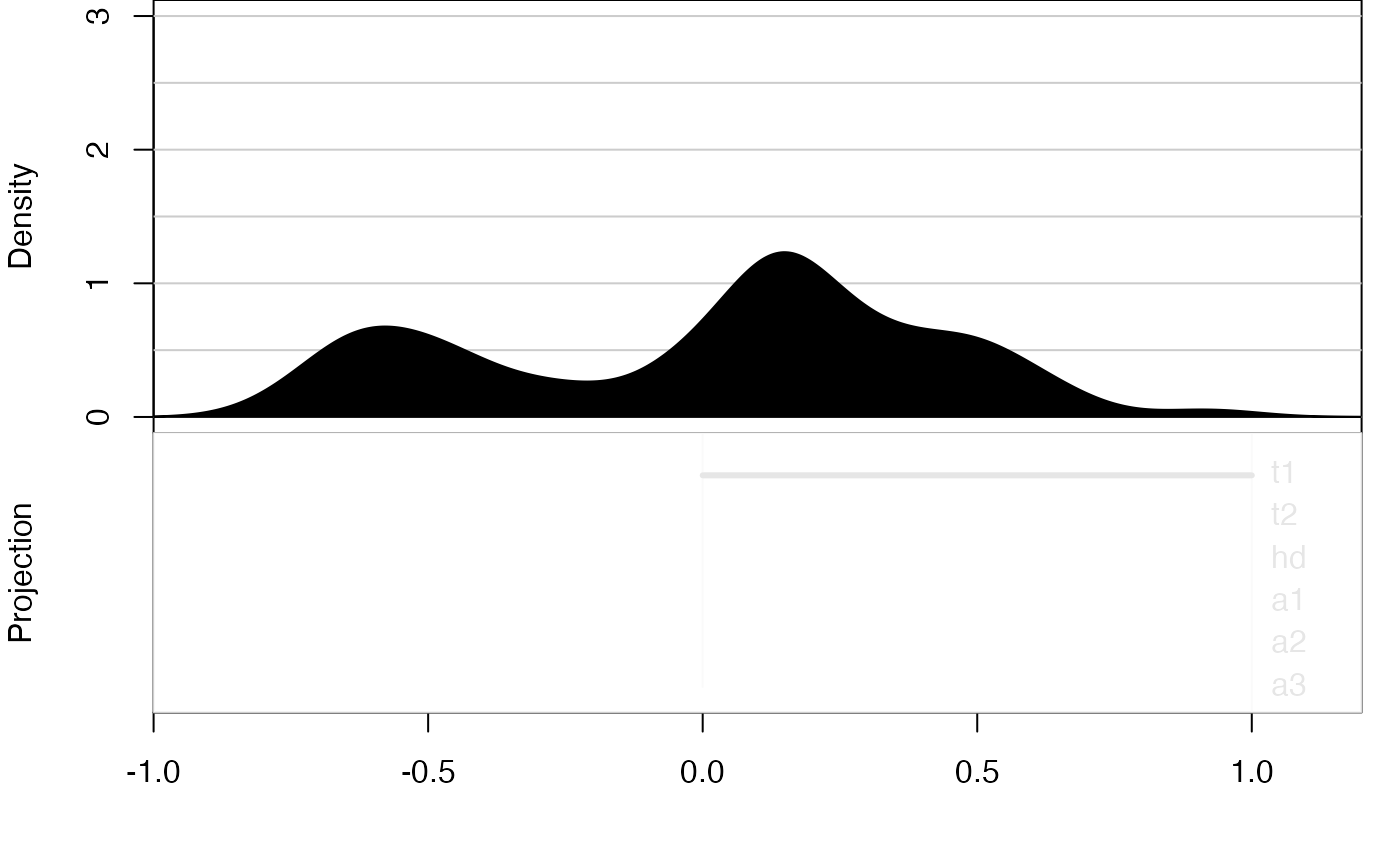
 # When the distribution is not centred, it tends to wander around in a
# distracting manner
animate_dist(flea[, 1:6], center = FALSE)
#> Converting input data to the required matrix format.
#> Using half_range 4.4
# When the distribution is not centred, it tends to wander around in a
# distracting manner
animate_dist(flea[, 1:6], center = FALSE)
#> Converting input data to the required matrix format.
#> Using half_range 4.4
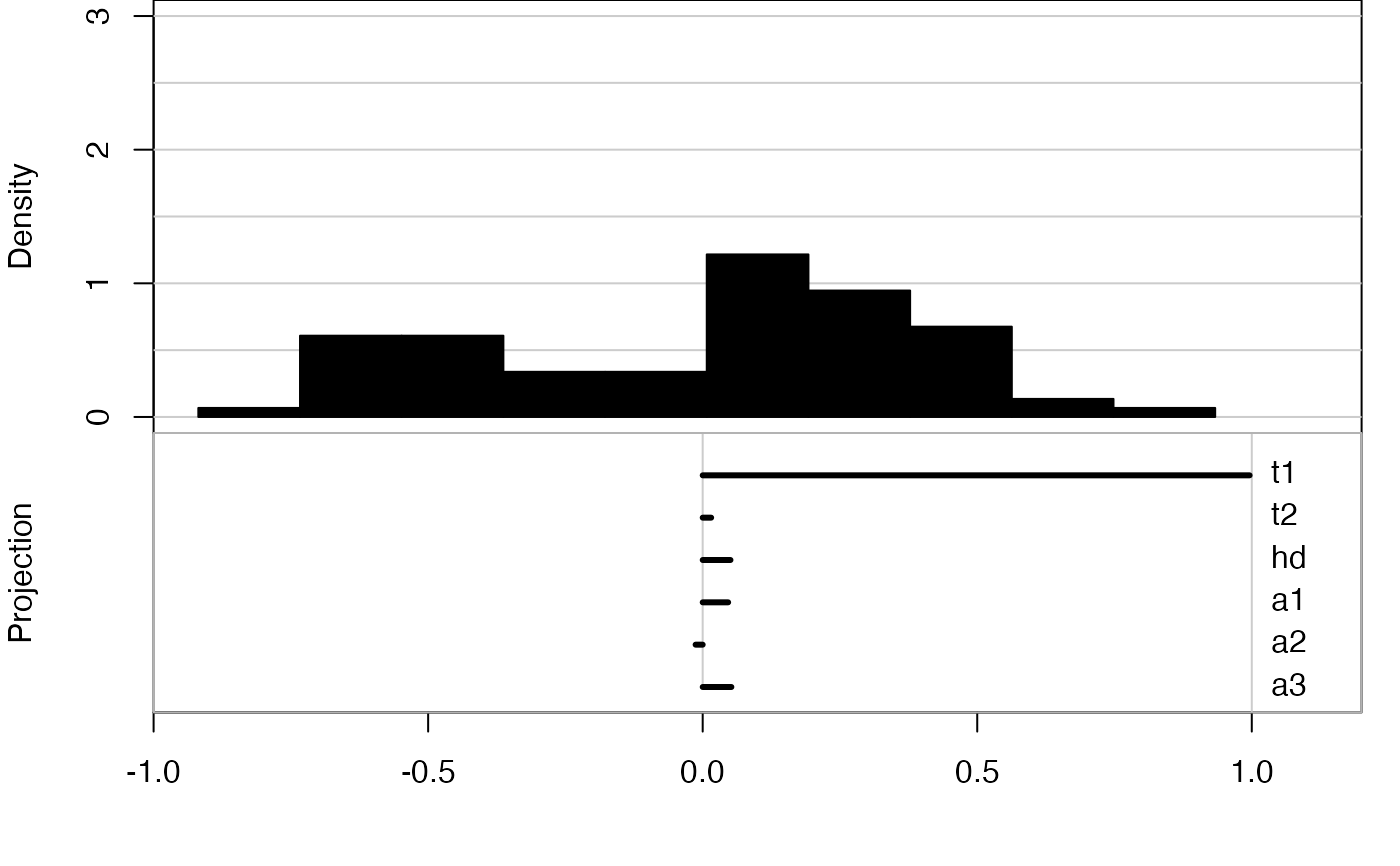
 # Alternatively, you can display the distribution with a histogram
animate_dist(flea[, 1:6], method = "hist")
#> Converting input data to the required matrix format.
#> Using half_range 4.4
# Alternatively, you can display the distribution with a histogram
animate_dist(flea[, 1:6], method = "hist")
#> Converting input data to the required matrix format.
#> Using half_range 4.4