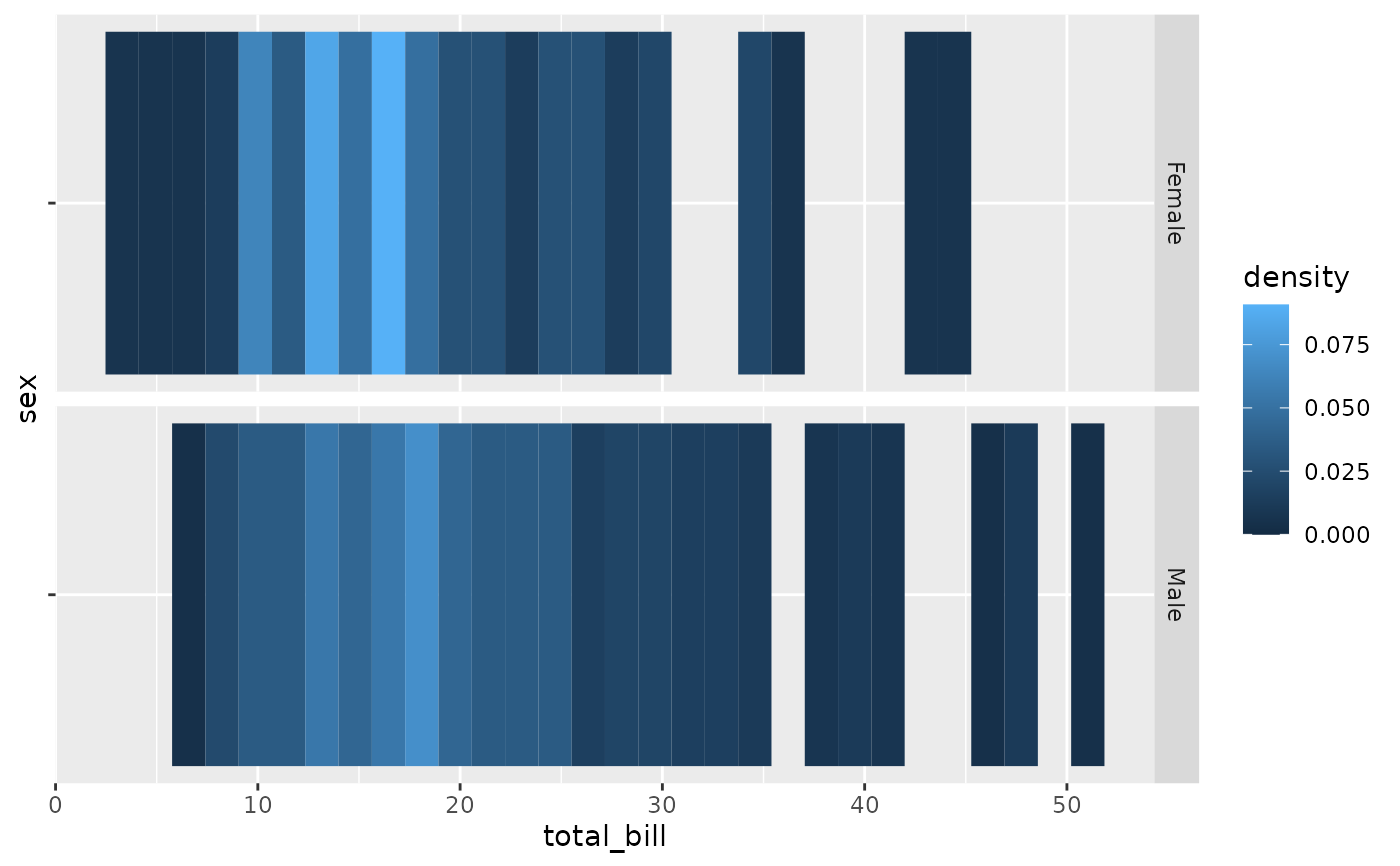
Displays a Tile Plot as densely as possible.
Examples
# Small function to display plots only if it's interactive
p_ <- GGally::print_if_interactive
data(tips)
p_(ggally_denstrip(tips, mapping = ggplot2::aes(x = total_bill, y = sex)))
#> `stat_bin()` using `bins = 30`. Pick better value with `binwidth`.
#> Warning: Removed 15 rows containing missing values or values outside the scale
#> range (`geom_bar()`).
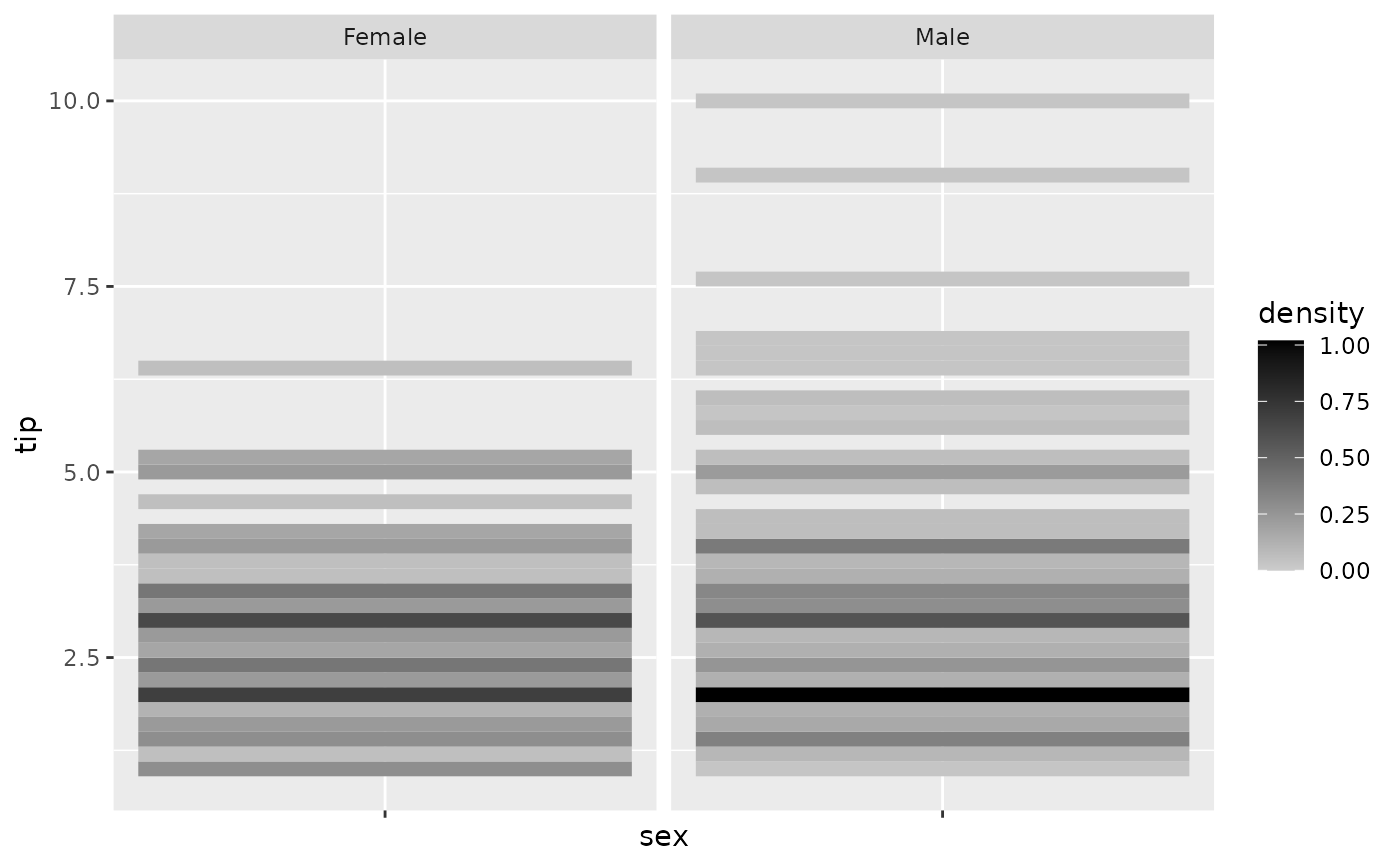
 p_(ggally_denstrip(
tips,
mapping = ggplot2::aes(sex, tip), binwidth = 0.2
) + ggplot2::scale_fill_gradient(low = "grey80", high = "black"))
#> Warning: Removed 41 rows containing missing values or values outside the scale
#> range (`geom_bar()`).
p_(ggally_denstrip(
tips,
mapping = ggplot2::aes(sex, tip), binwidth = 0.2
) + ggplot2::scale_fill_gradient(low = "grey80", high = "black"))
#> Warning: Removed 41 rows containing missing values or values outside the scale
#> range (`geom_bar()`).