ggbivariate(): Plot an outcome with several potential explanatory variables
Joseph Larmarange
May 16, 2016
Source:vignettes/ggbivariate.Rmd
ggbivariate.Rmd
GGally::ggbivariate()
The purpose of this function is to easily plot a visualization of the bivariate relation between one outcome and several explanatory variables.
Basic example
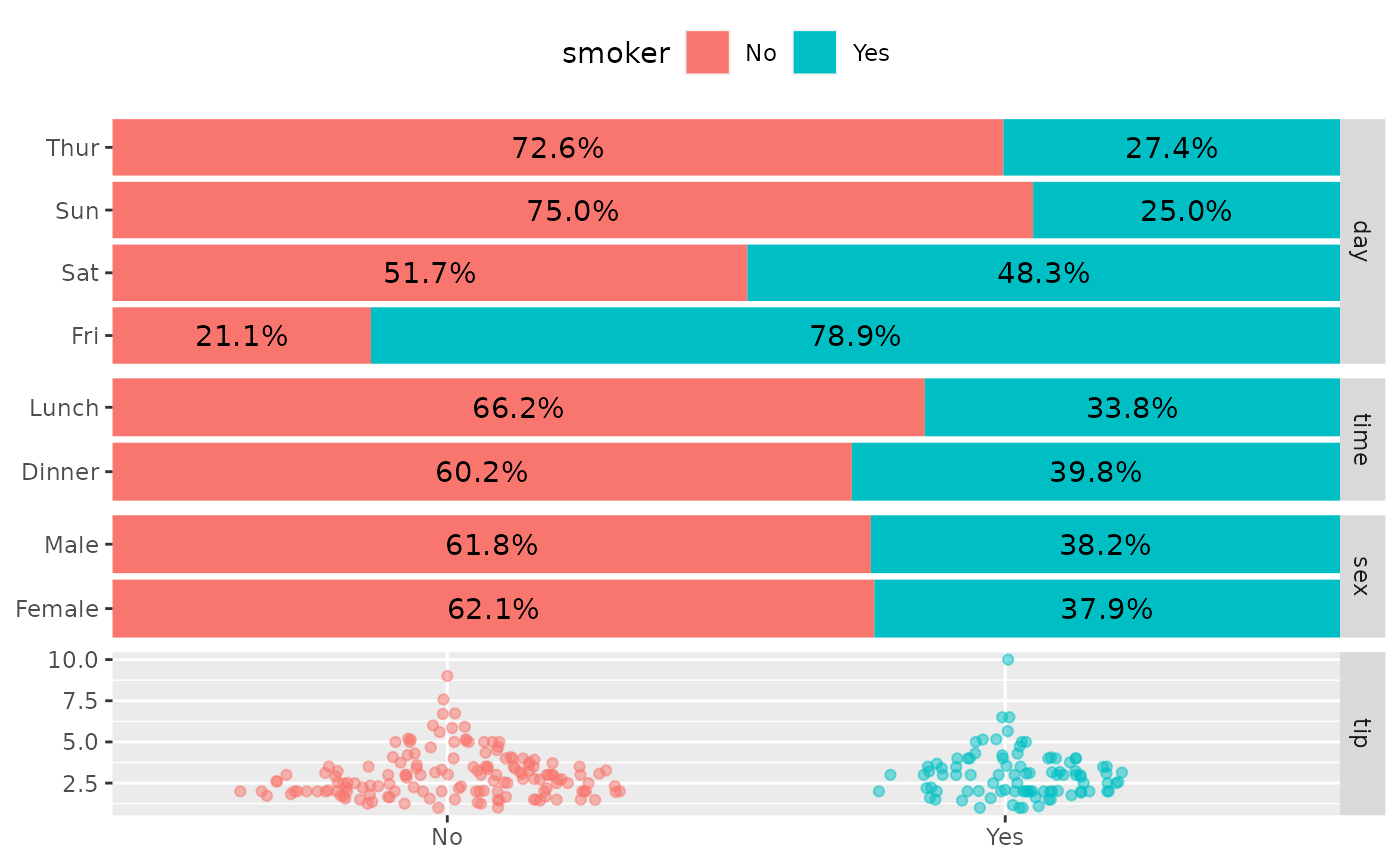
Simply indicate the outcome and the explanatory variables. Both could be discrete or continuous.
data(tips)
ggbivariate(tips, outcome = "smoker", explanatory = c("day", "time", "sex", "tip"))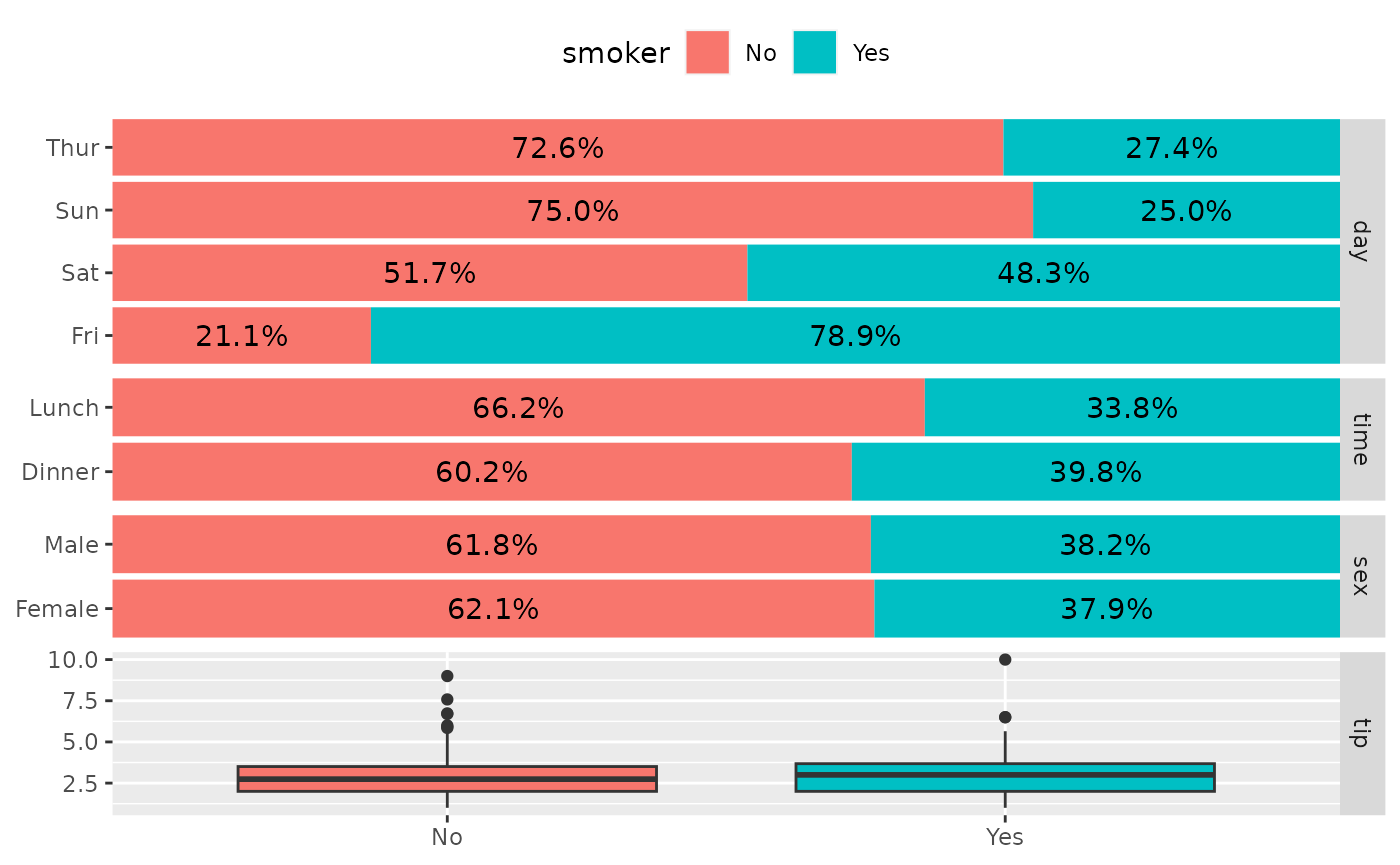
ggbivariate(tips, outcome = "total_bill", explanatory = c("day", "time", "sex", "tip"))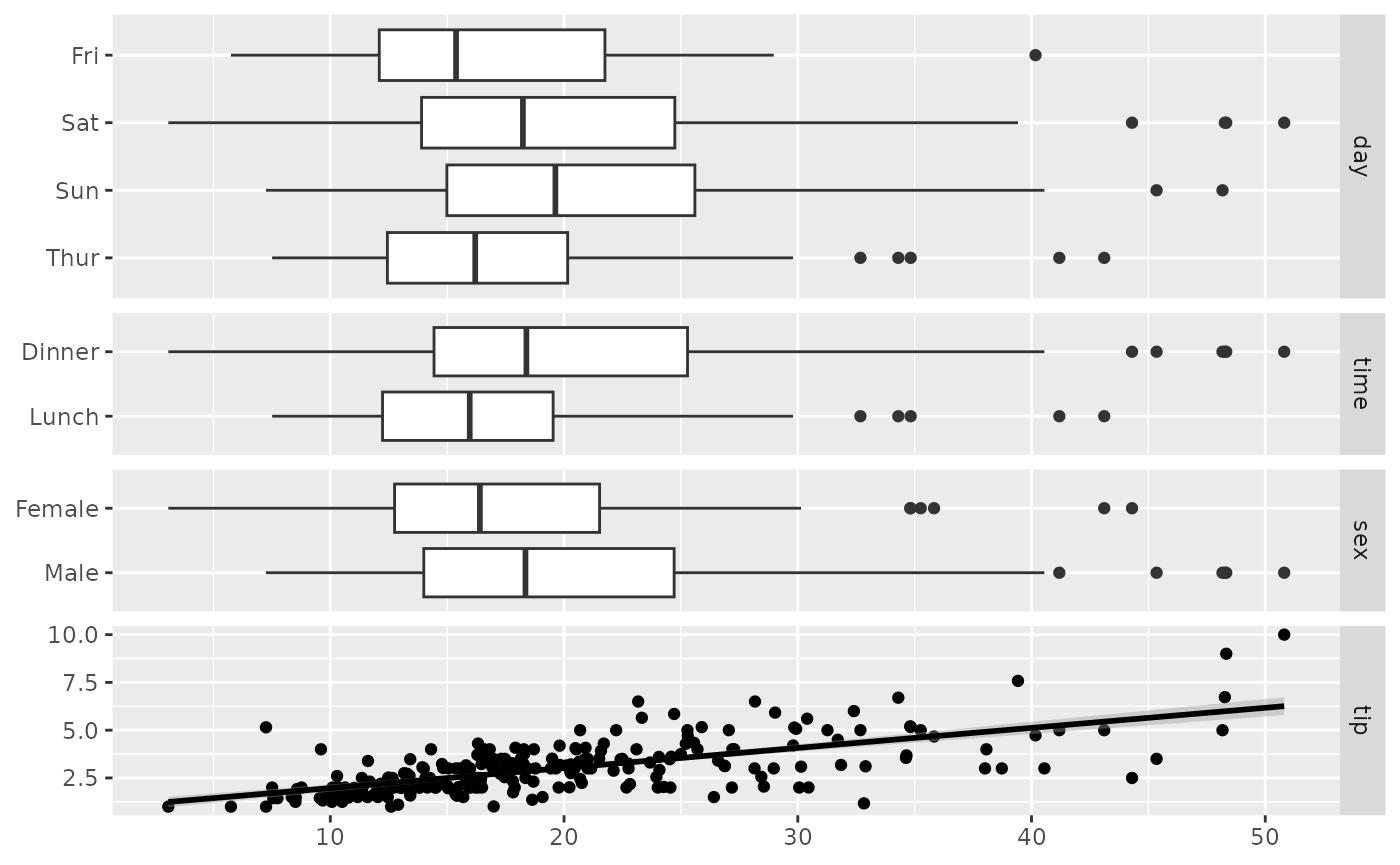
If no explanatory variables are provided, will take all available variables other than the outcome.
ggbivariate(tips, "smoker")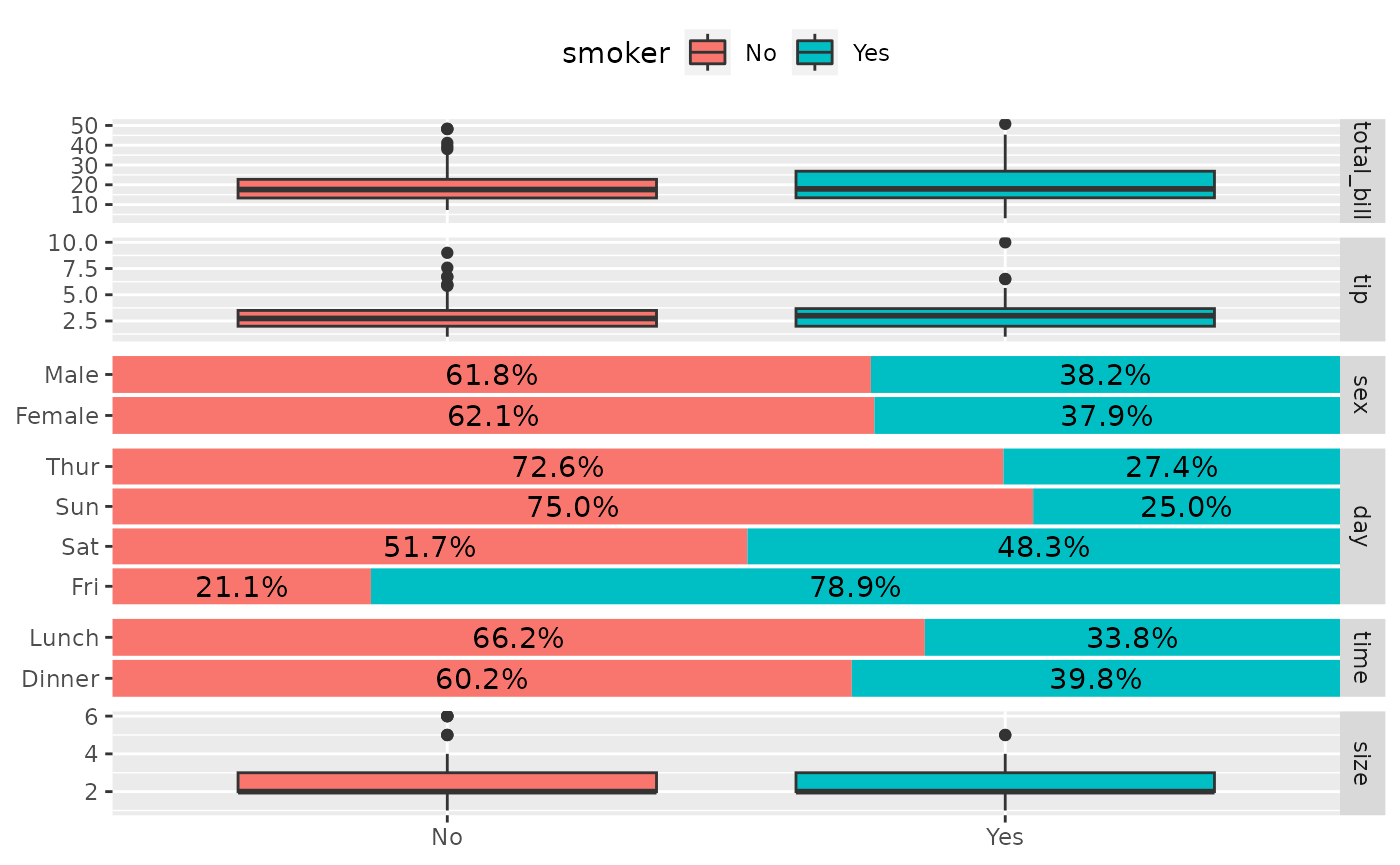
Customize plot title and legend title
ggbivariate(
  tips, "smoker", c("day", "time", "sex", "tip"),
  title = "Custom title"
) +
  labs(fill = "Smoker ?")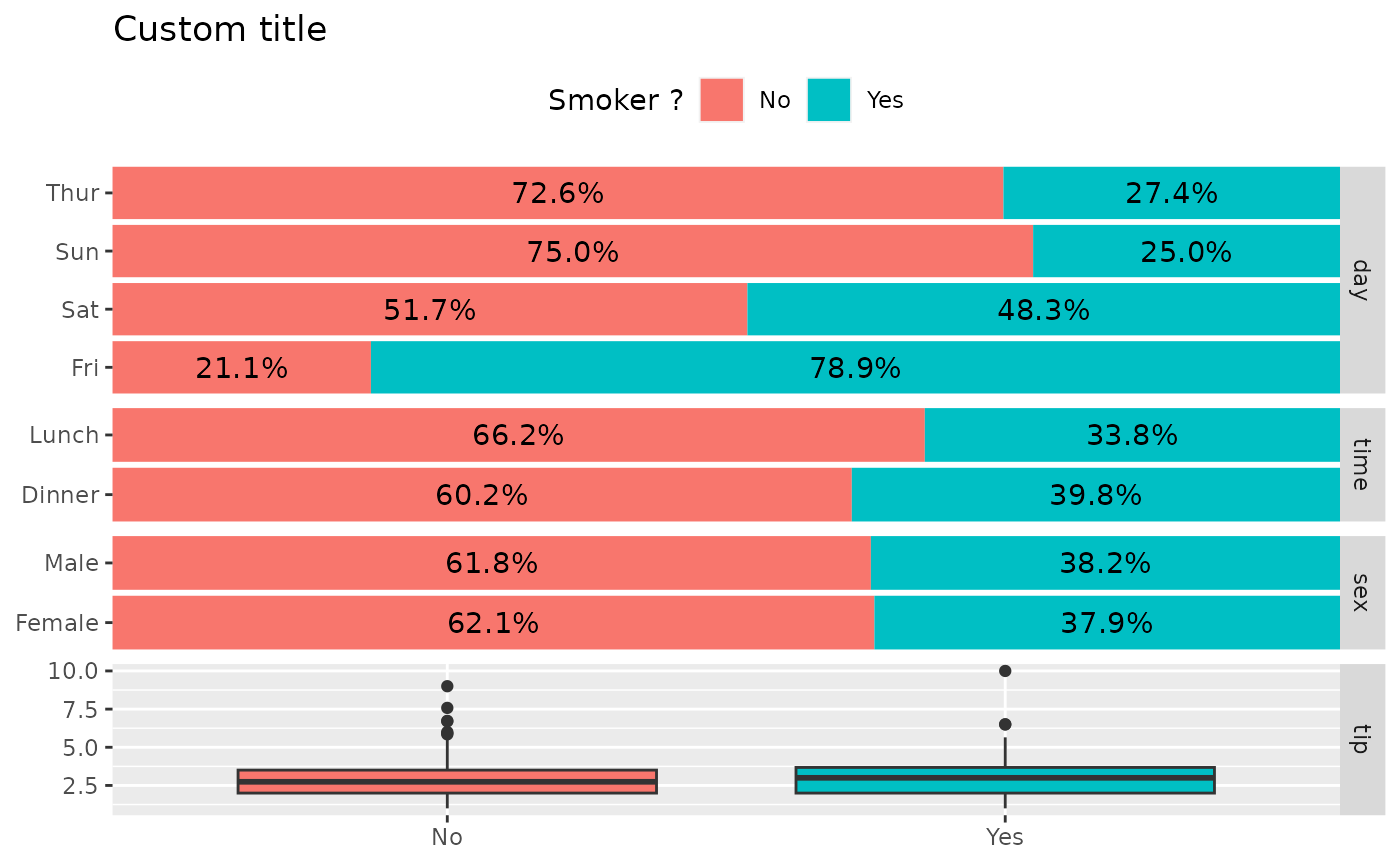
Customize fill colour scale
ggbivariate(tips, "smoker", c("day", "time", "sex", "tip")) +
  scale_fill_brewer(type = "qual")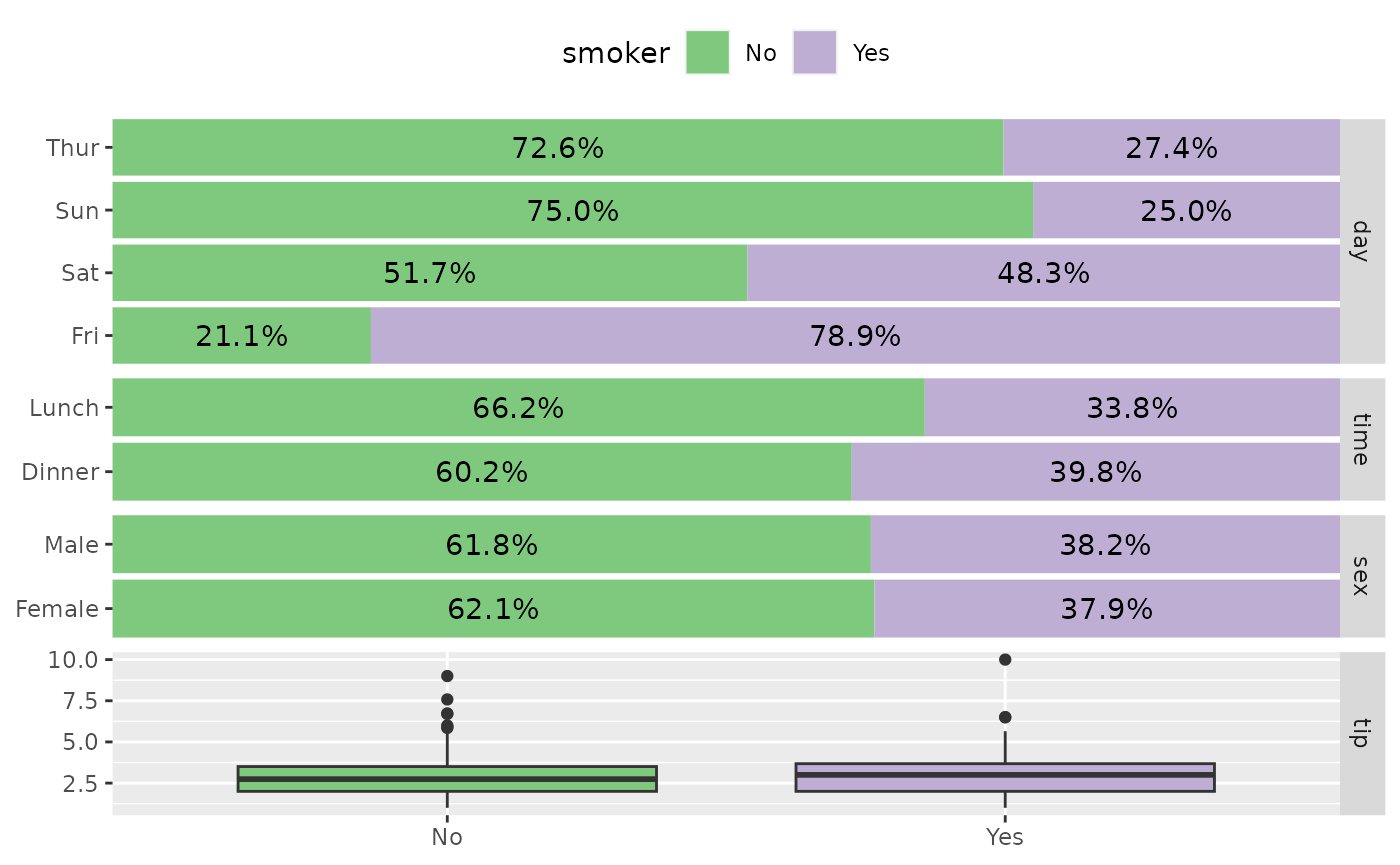
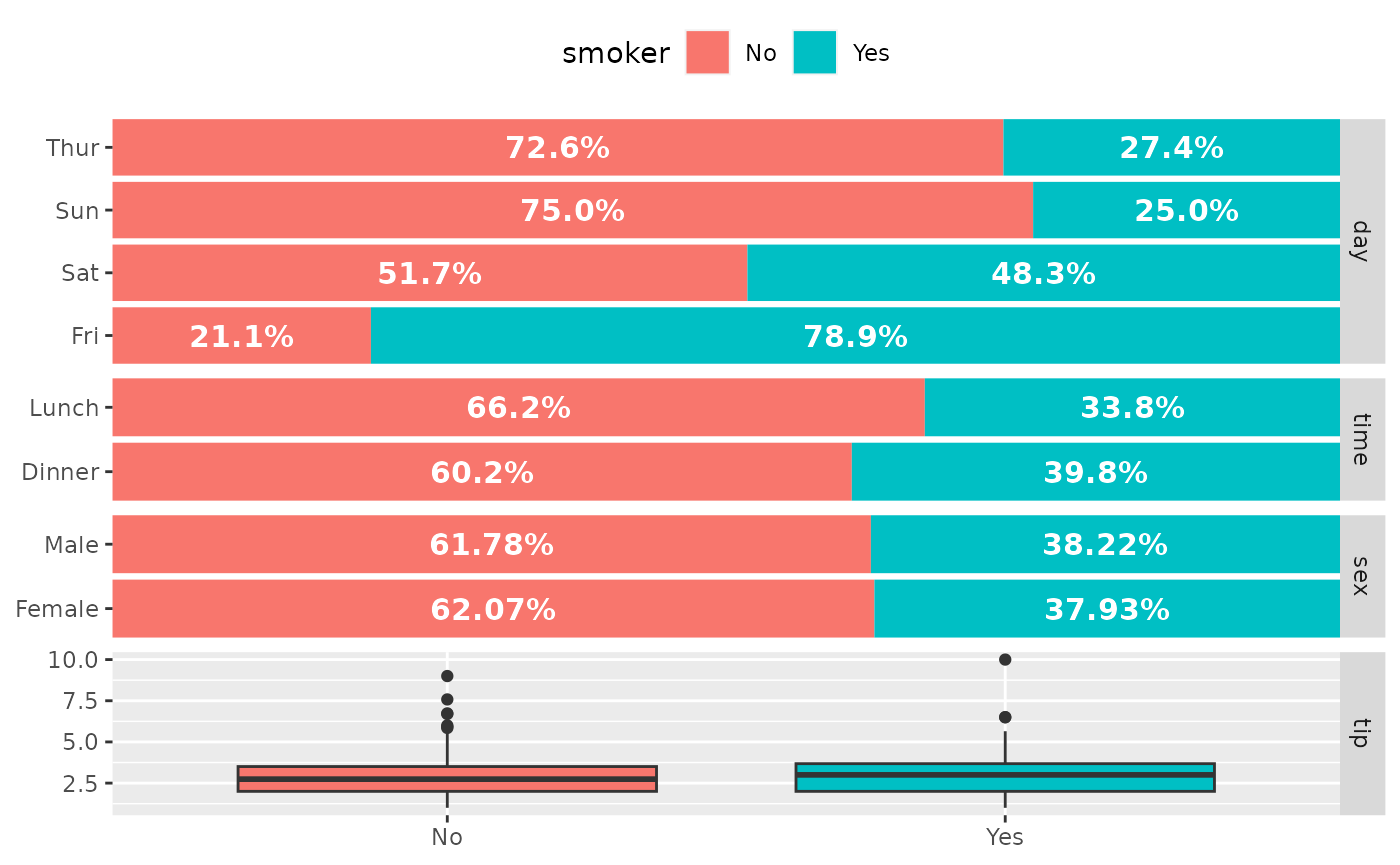
Customize labels
ggbivariate(
  tips, "smoker", c("day", "time", "sex", "tip"),
  rowbar_args = list(
    colour = "white",
    size = 4,
    fontface = "bold",
    label_format = scales::label_percent(accurary = 1)
  )
)
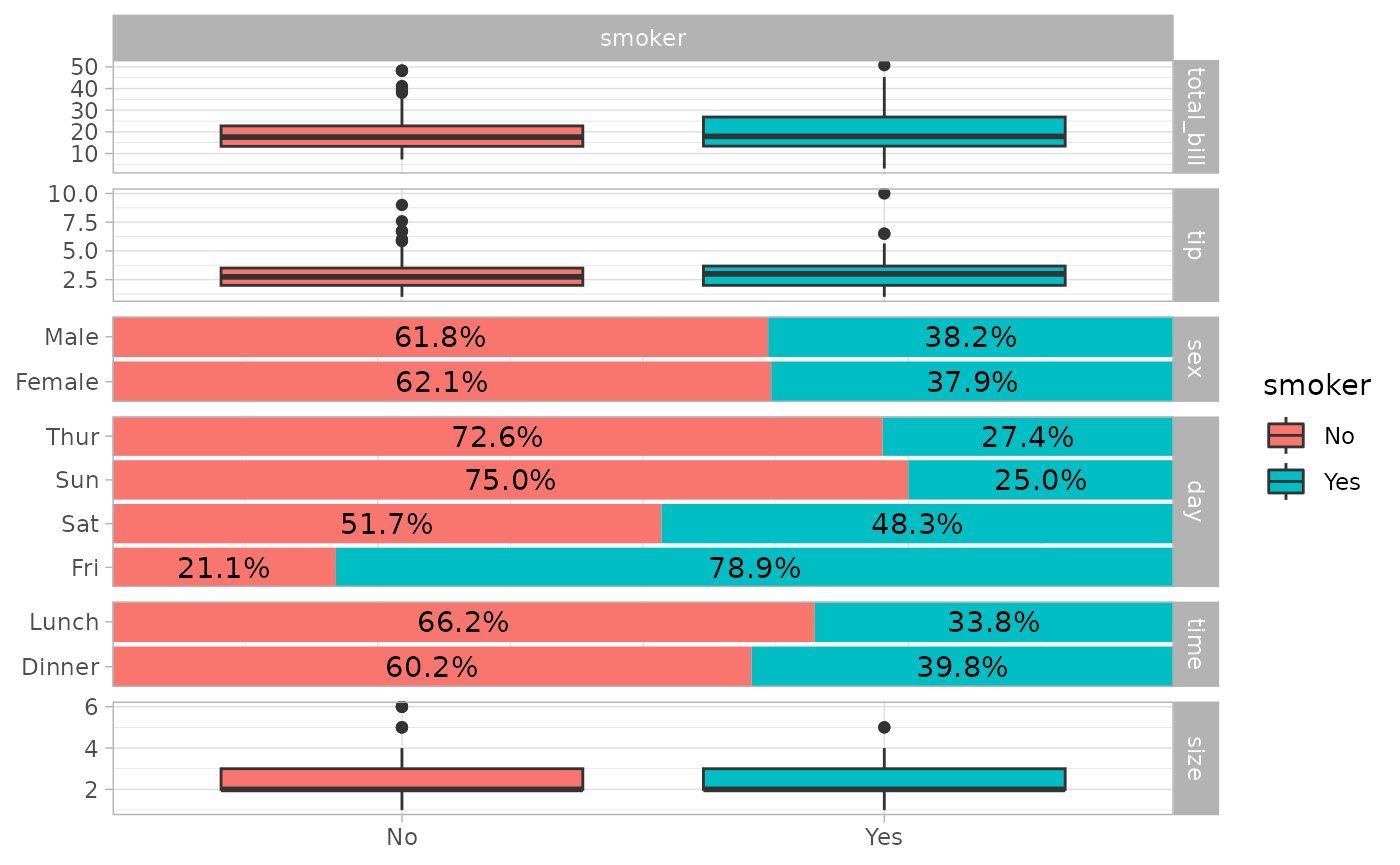
Choose the sub-plot from which to get the legend
ggbivariate(tips, "smoker")
ggbivariate(tips, "smoker", legend = 3)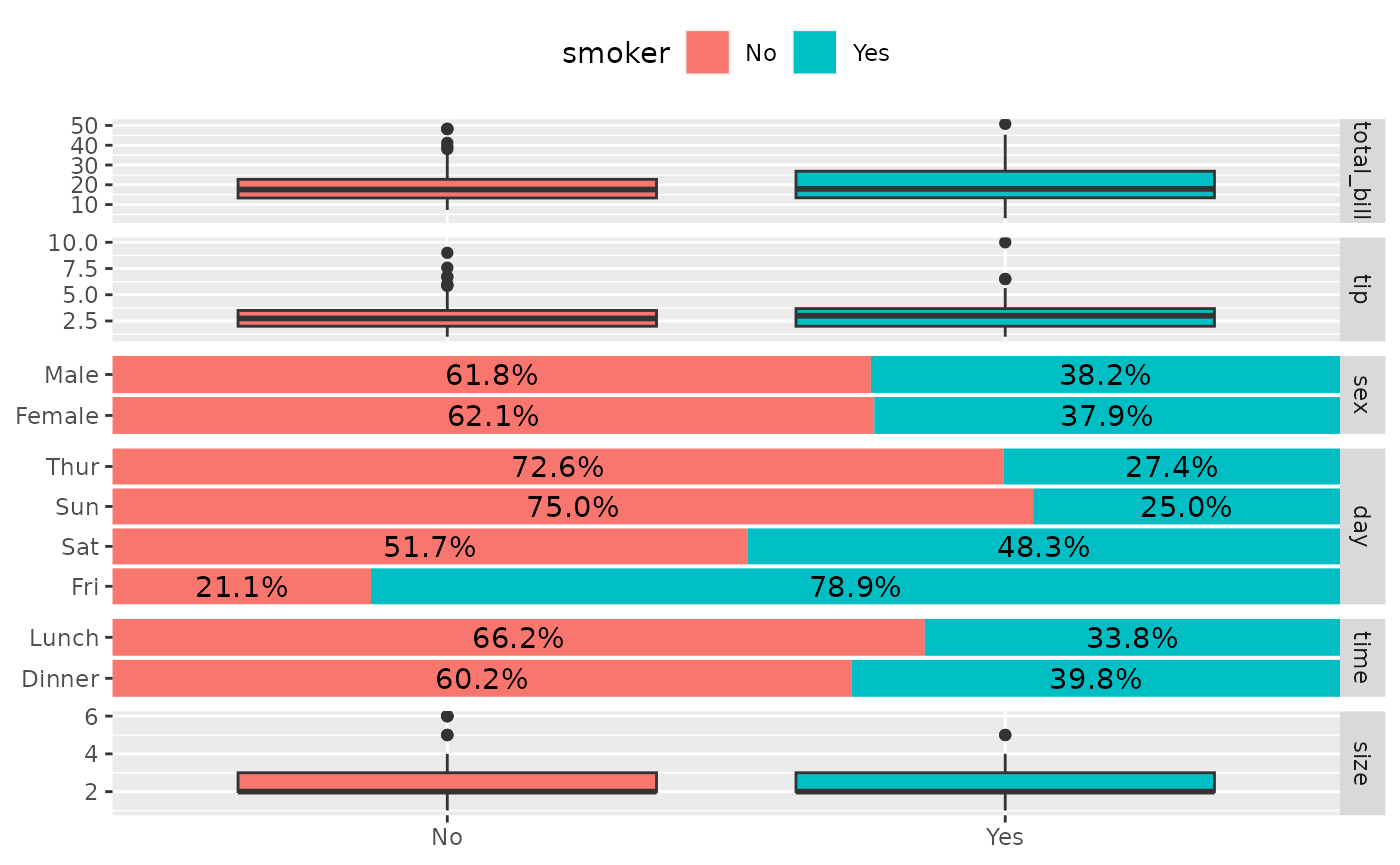
Use mapping to indicate weights
d <- as.data.frame(Titanic)
ggbivariate(d, "Survived", mapping = aes(weight = Freq))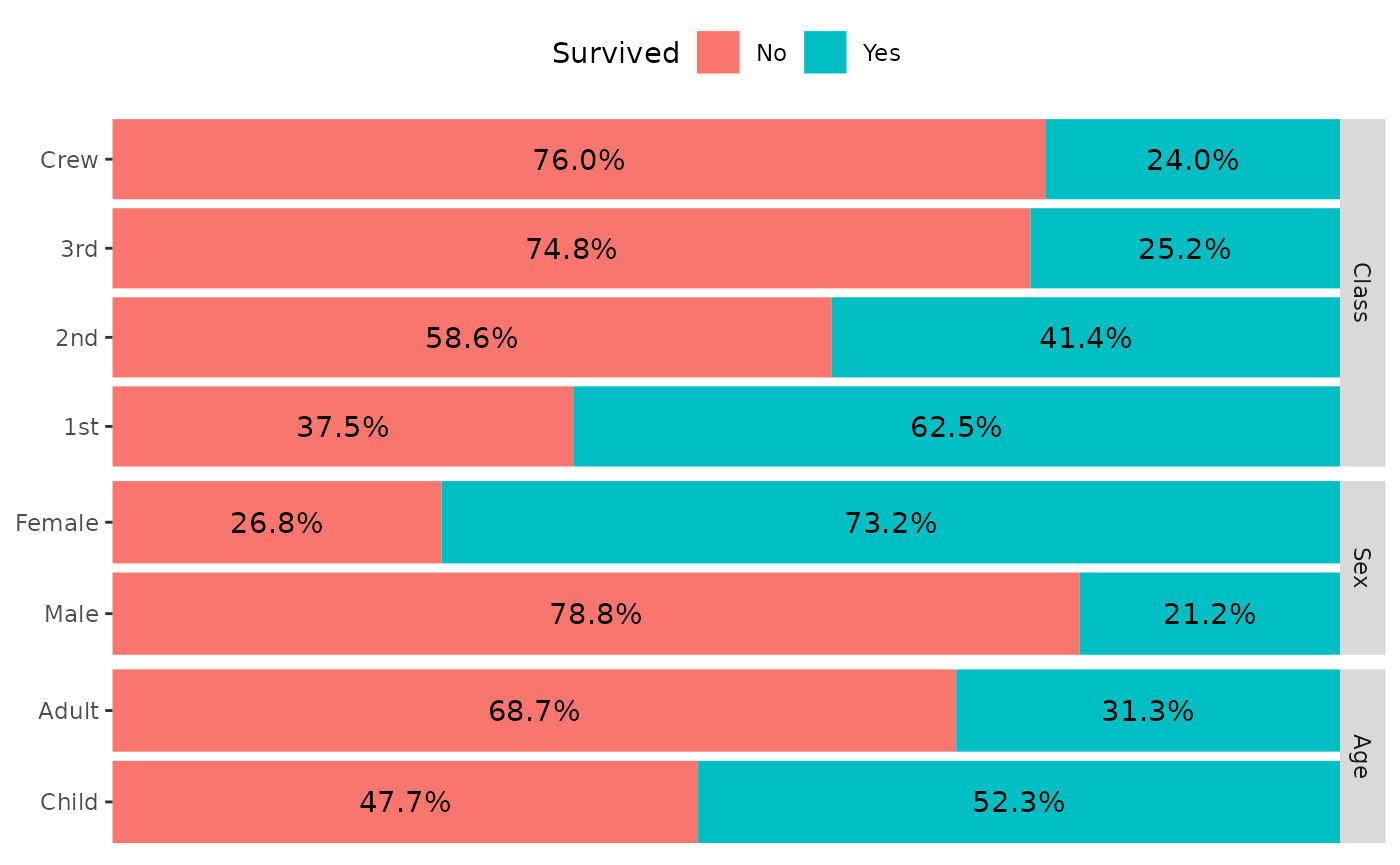
Use types to customize types of subplots
ggbivariate(
  tips,
  outcome = "smoker",
  explanatory = c("day", "time", "sex", "tip"),
  types = list(comboVertical = "autopoint")
)
For more customization options, you could directly use
ggduo() (see also vig_ggally("ggduo")).