Display an outcome using several potential explanatory variables
Source:R/ggbivariate.R
ggbivariate.Rdggbivariate is a variant of ggduo for plotting
an outcome variable with several potential explanatory variables.
Usage
ggbivariate(
  data,
  outcome,
  explanatory = NULL,
  mapping = NULL,
  types = NULL,
  ...,
  rowbar_args = NULL
)
Arguments
- data
dataset to be used, can have both categorical and numerical variables
- outcome
name or position of the outcome variable (one variable only)
- explanatory
names or positions of the explanatory variables (if
NULL, will take all variables other thanoutcome)- mapping
additional aesthetic to be used, for example to indicate weights (see examples)
- types
custom types of plots to use, see
ggduo- ...
additional arguments passed to
ggduo(see examples)- rowbar_args
additional arguments passed to
ggally_rowbar(see examples)
Examples
# Small function to display plots only if it's interactive
p_ <- GGally::print_if_interactive
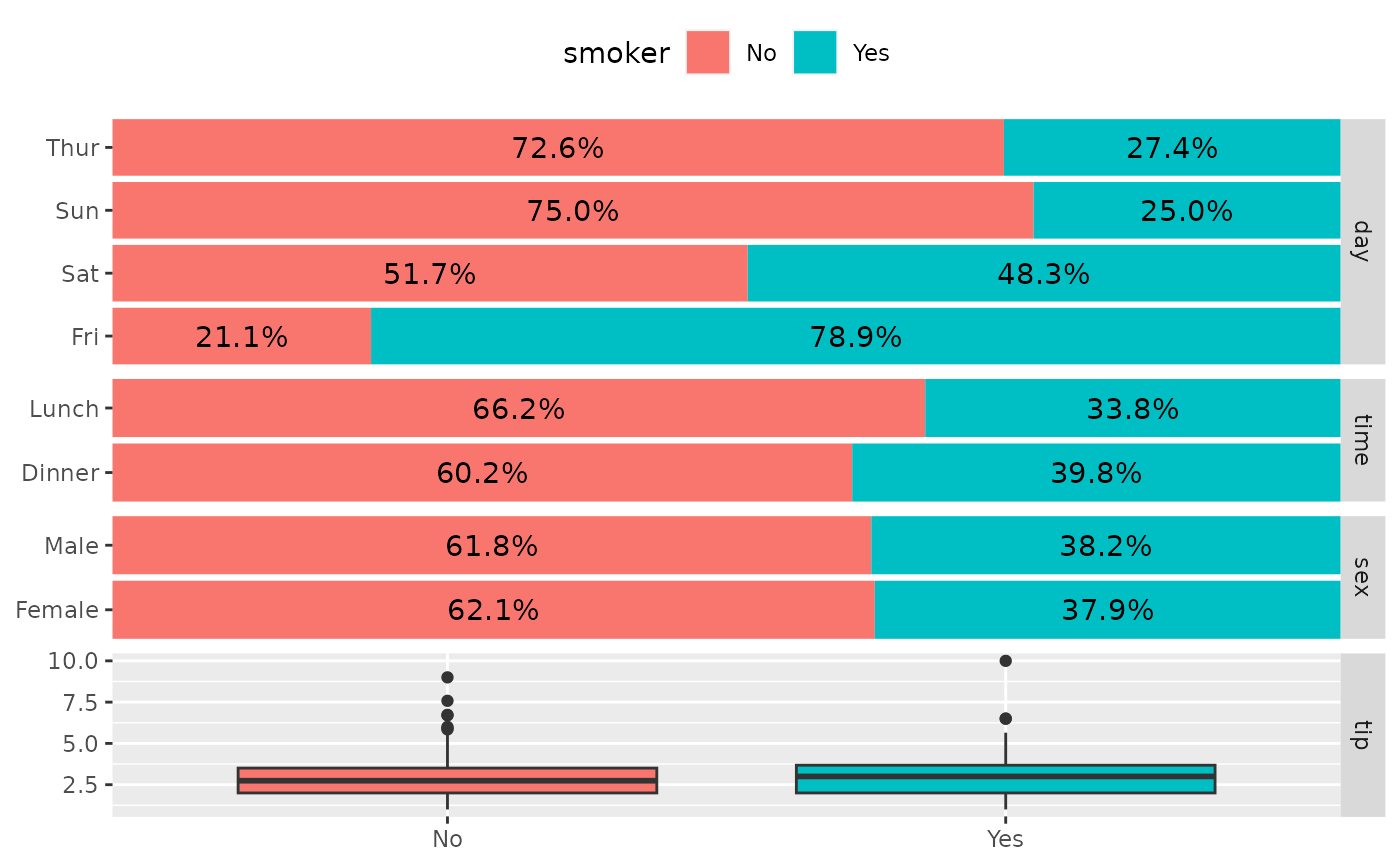
data(tips)
p_(ggbivariate(tips, "smoker", c("day", "time", "sex", "tip")))
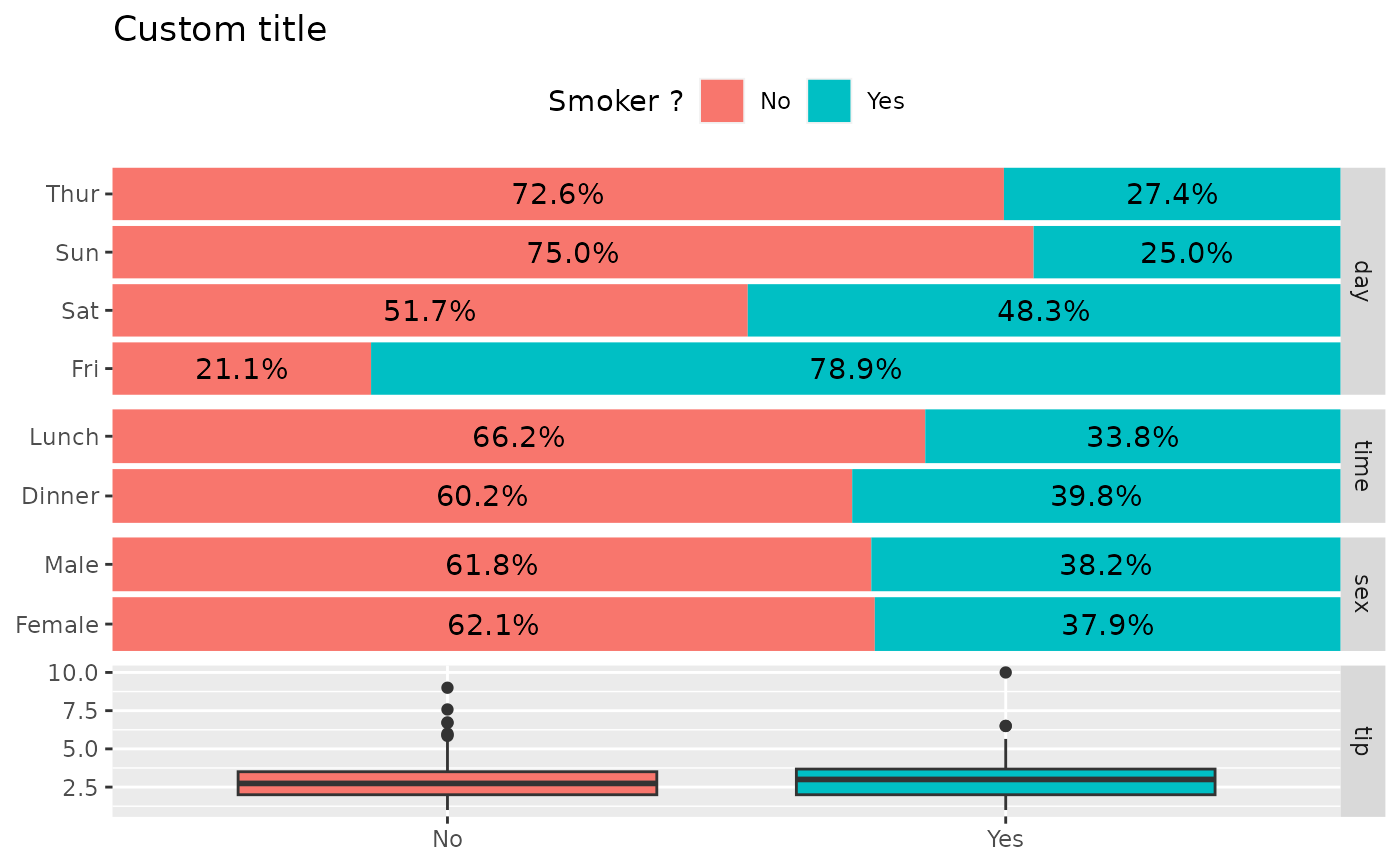
 # Personalize plot title and legend title
p_(ggbivariate(
tips, "smoker", c("day", "time", "sex", "tip"),
title = "Custom title"
) +
labs(fill = "Smoker ?"))
# Personalize plot title and legend title
p_(ggbivariate(
tips, "smoker", c("day", "time", "sex", "tip"),
title = "Custom title"
) +
labs(fill = "Smoker ?"))
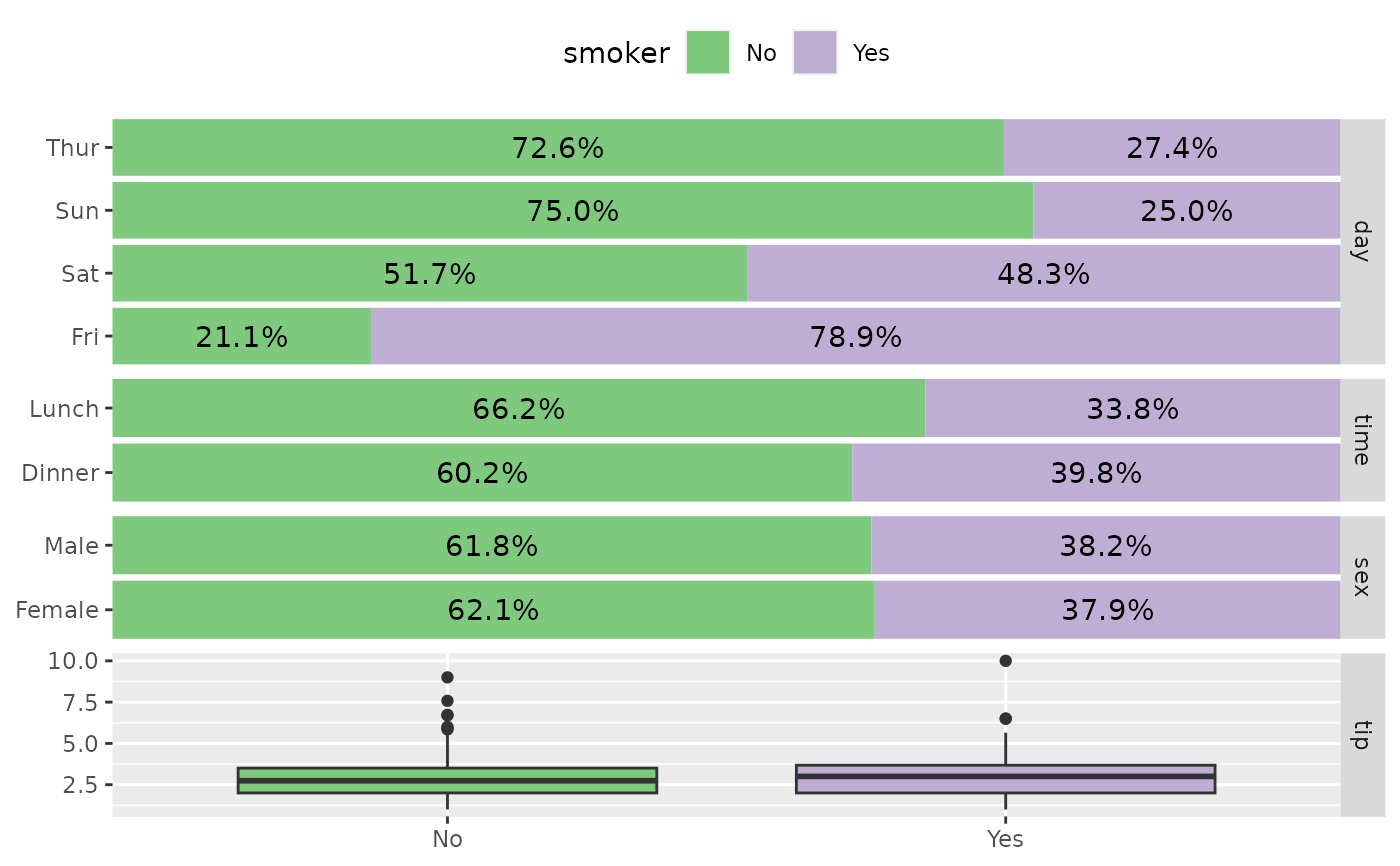
 # Customize fill colour scale
p_(ggbivariate(tips, "smoker", c("day", "time", "sex", "tip")) +
scale_fill_brewer(type = "qual"))
# Customize fill colour scale
p_(ggbivariate(tips, "smoker", c("day", "time", "sex", "tip")) +
scale_fill_brewer(type = "qual"))
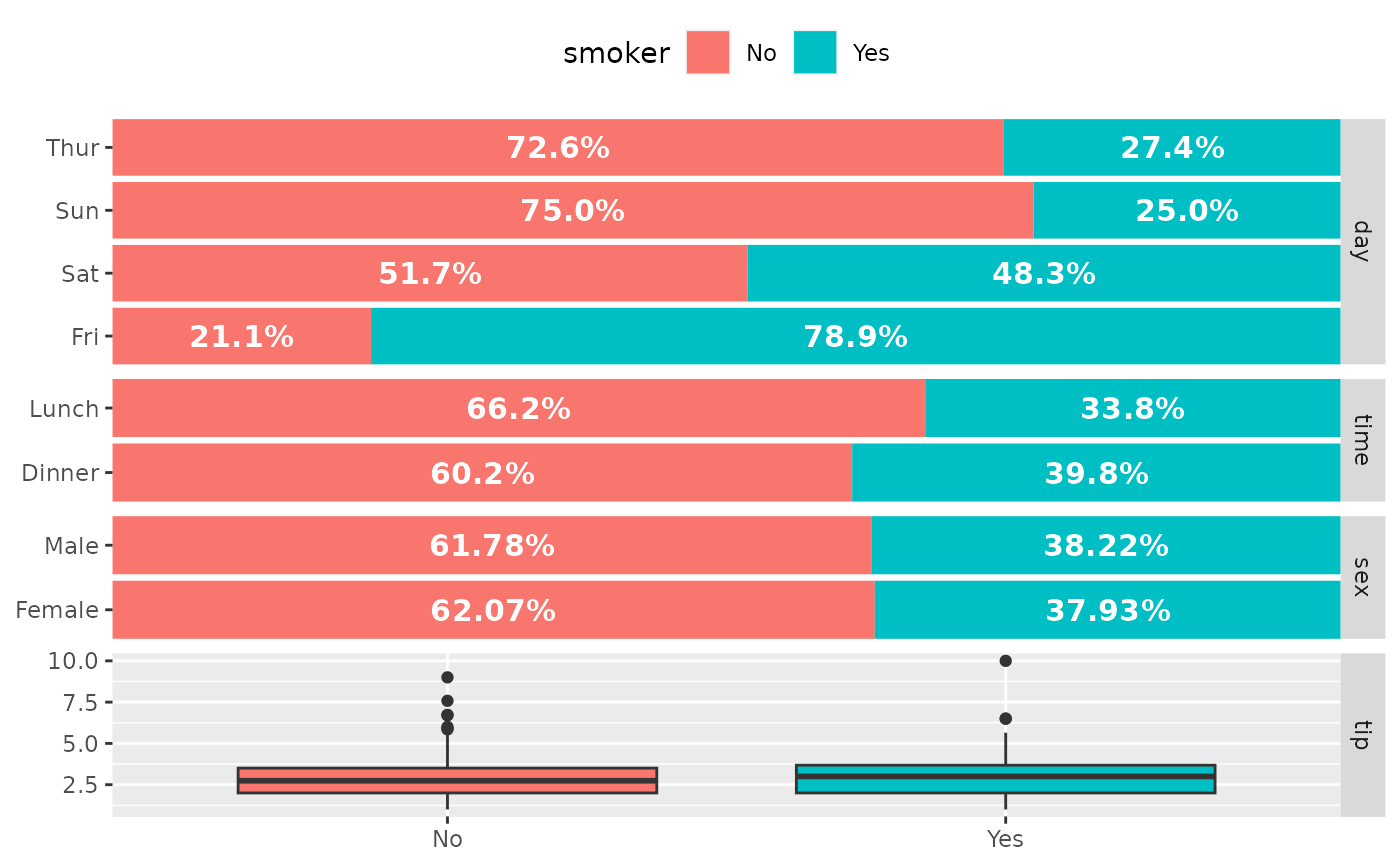
 # Customize labels
p_(ggbivariate(
tips, "smoker", c("day", "time", "sex", "tip"),
rowbar_args = list(
colour = "white",
size = 4,
fontface = "bold",
label_format = scales::label_percent(accurary = 1)
)
))
# Customize labels
p_(ggbivariate(
tips, "smoker", c("day", "time", "sex", "tip"),
rowbar_args = list(
colour = "white",
size = 4,
fontface = "bold",
label_format = scales::label_percent(accurary = 1)
)
))
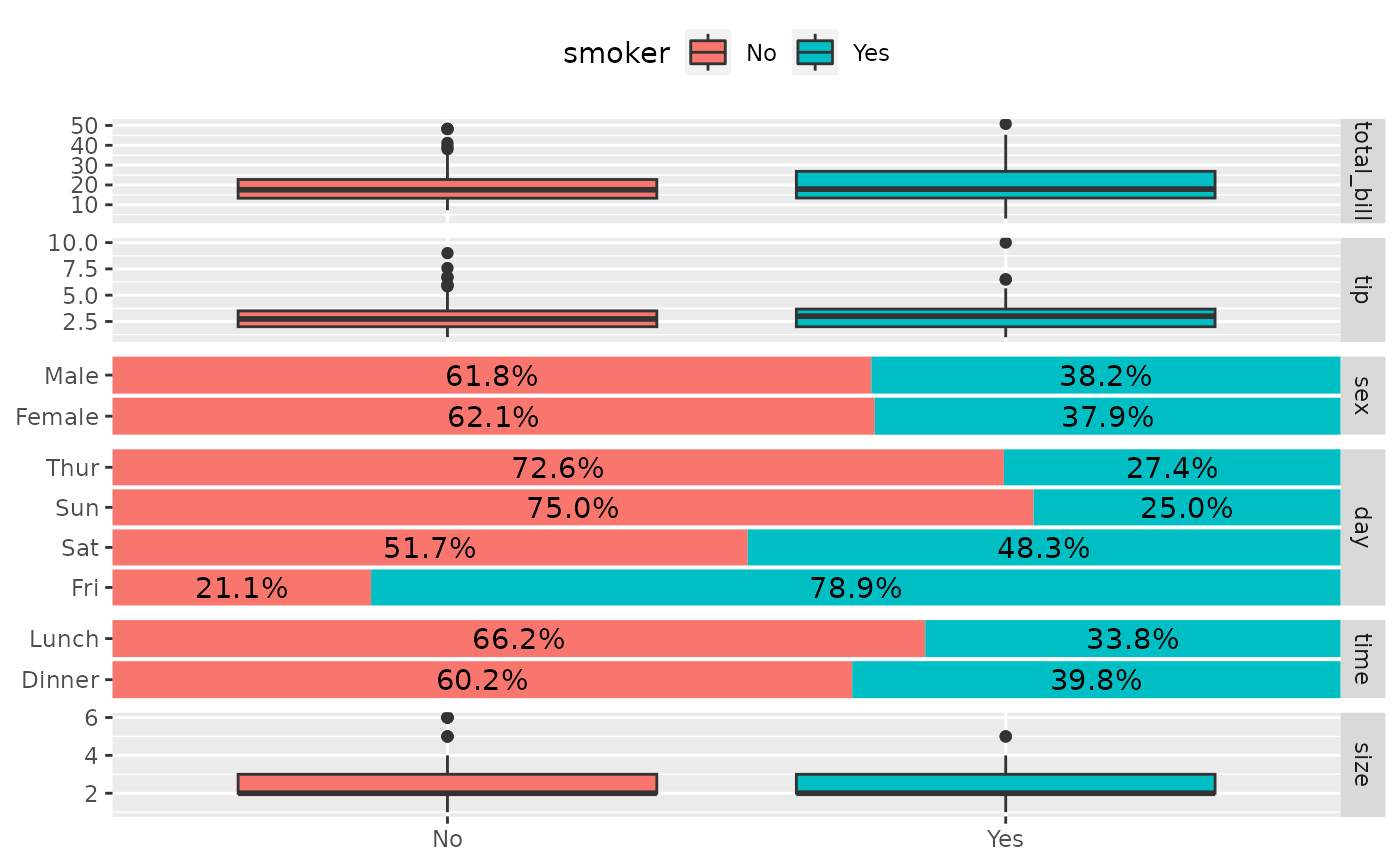
 # Choose the sub-plot from which get legend
p_(ggbivariate(tips, "smoker"))
# Choose the sub-plot from which get legend
p_(ggbivariate(tips, "smoker"))
 p_(ggbivariate(tips, "smoker", legend = 3))
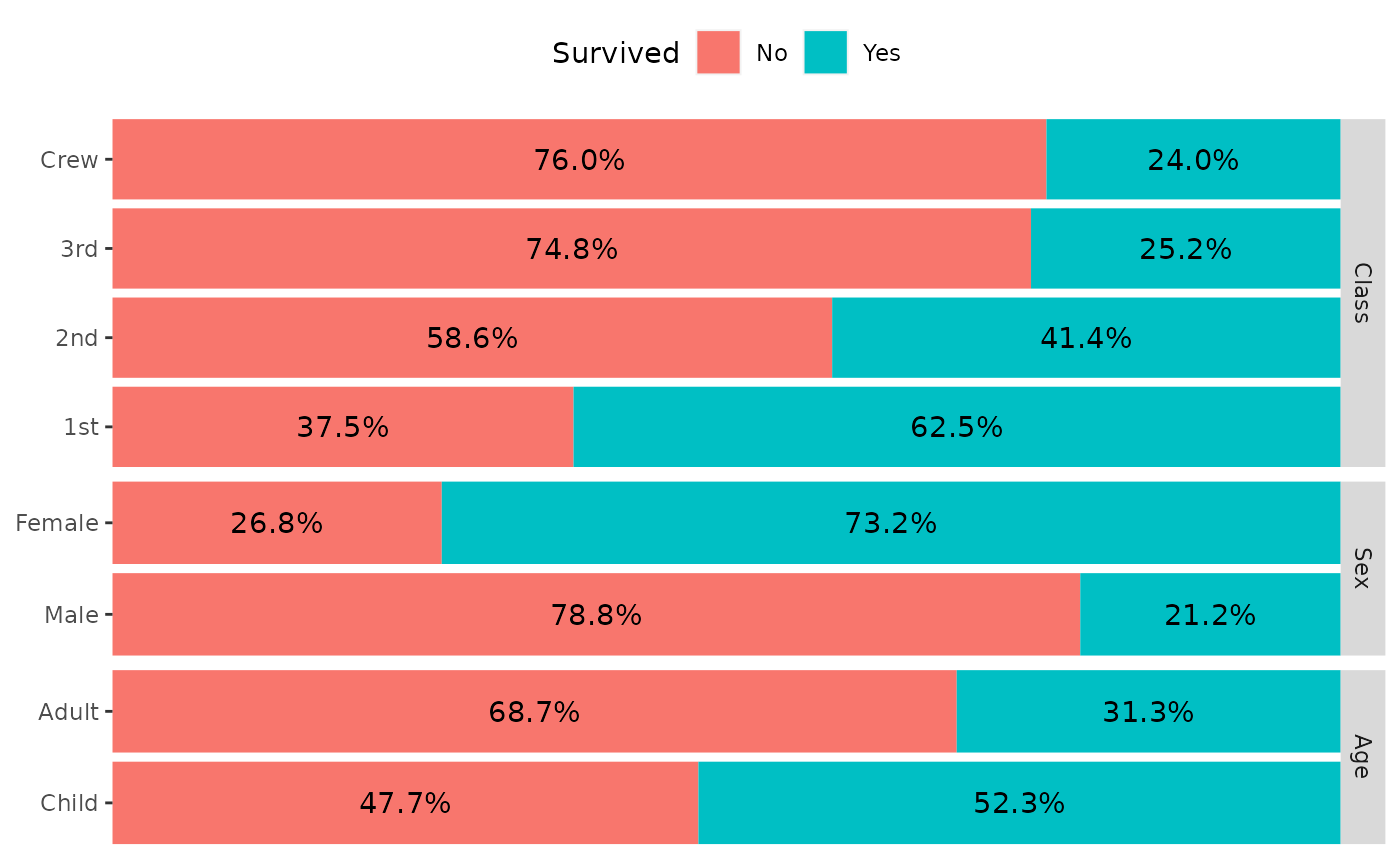
 # Use mapping to indicate weights
d <- as.data.frame(Titanic)
p_(ggbivariate(d, "Survived", mapping = aes(weight = Freq)))
# Use mapping to indicate weights
d <- as.data.frame(Titanic)
p_(ggbivariate(d, "Survived", mapping = aes(weight = Freq)))
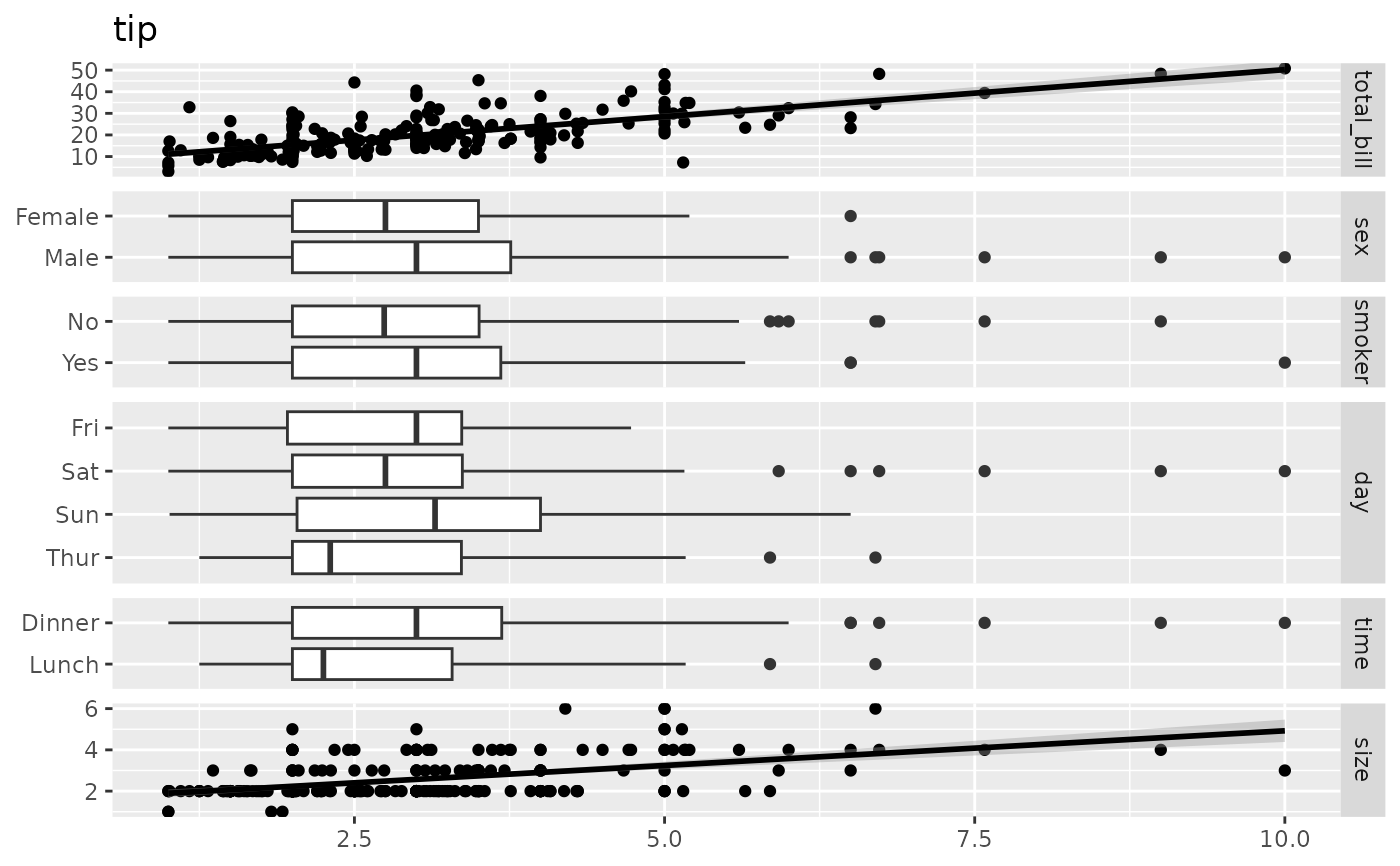
 # outcome can be numerical
p_(ggbivariate(tips, outcome = "tip", title = "tip"))
# outcome can be numerical
p_(ggbivariate(tips, outcome = "tip", title = "tip"))