X variables are plotted using geom_bar and are faceted by the Y variable.
Examples
# Small function to display plots only if it's interactive
p_ <- GGally::print_if_interactive
data(tips)
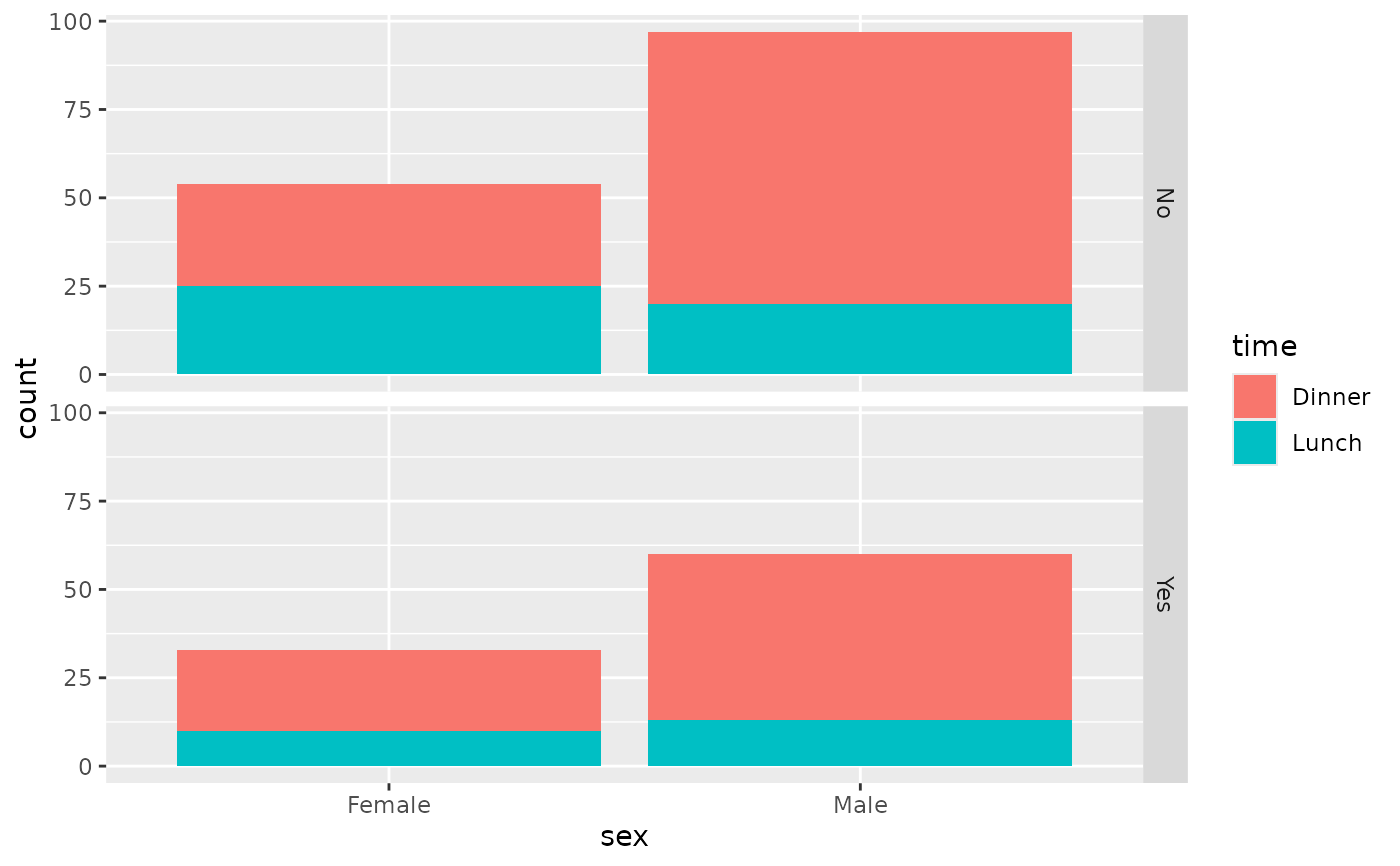
p_(ggally_facetbar(tips, ggplot2::aes(x = sex, y = smoker, fill = time)))
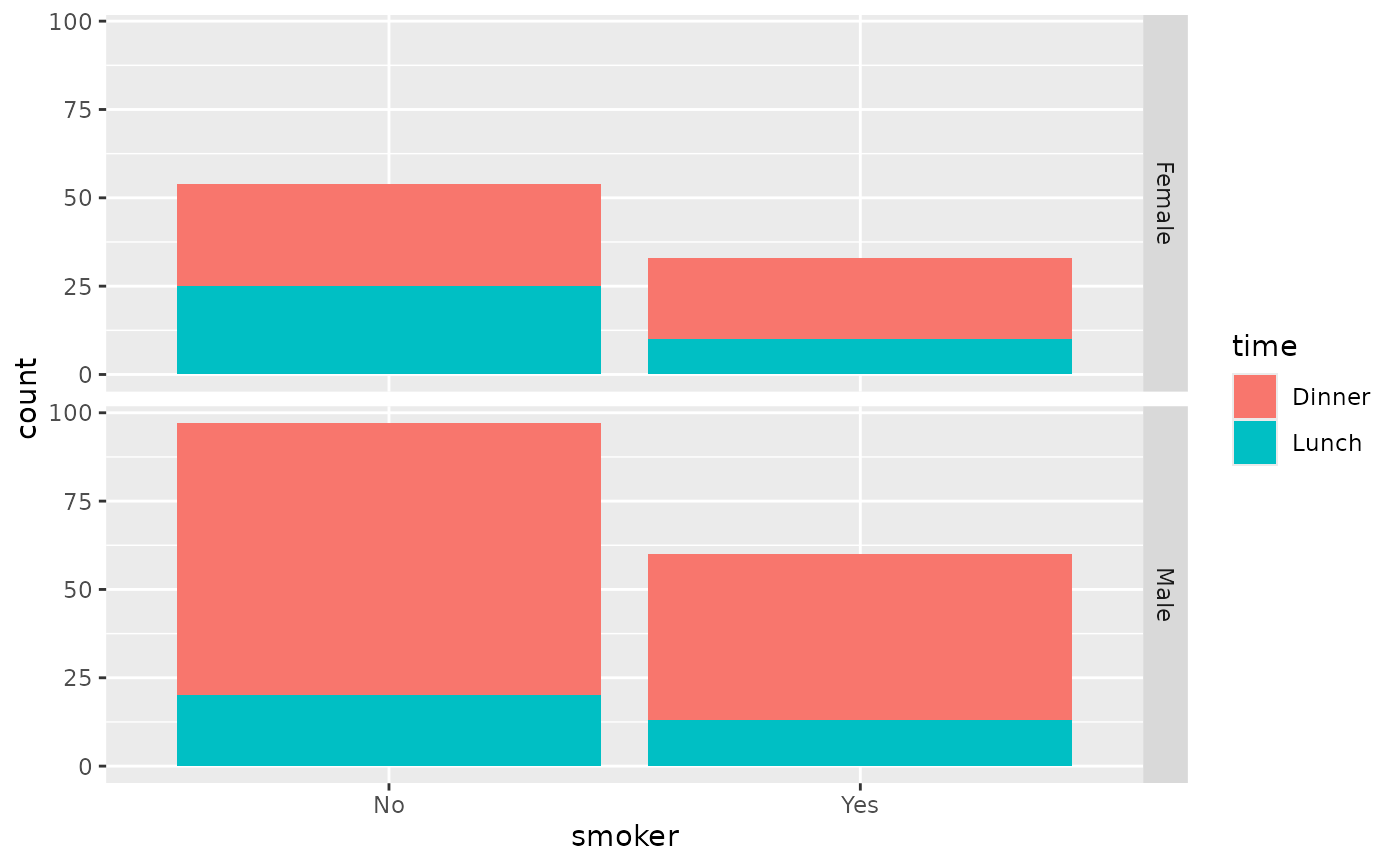
 p_(ggally_facetbar(tips, ggplot2::aes(x = smoker, y = sex, fill = time)))