Make density plots by displaying subsets of the data in different panels.
Examples
# Small function to display plots only if it's interactive
p_ <- GGally::print_if_interactive
data(tips)
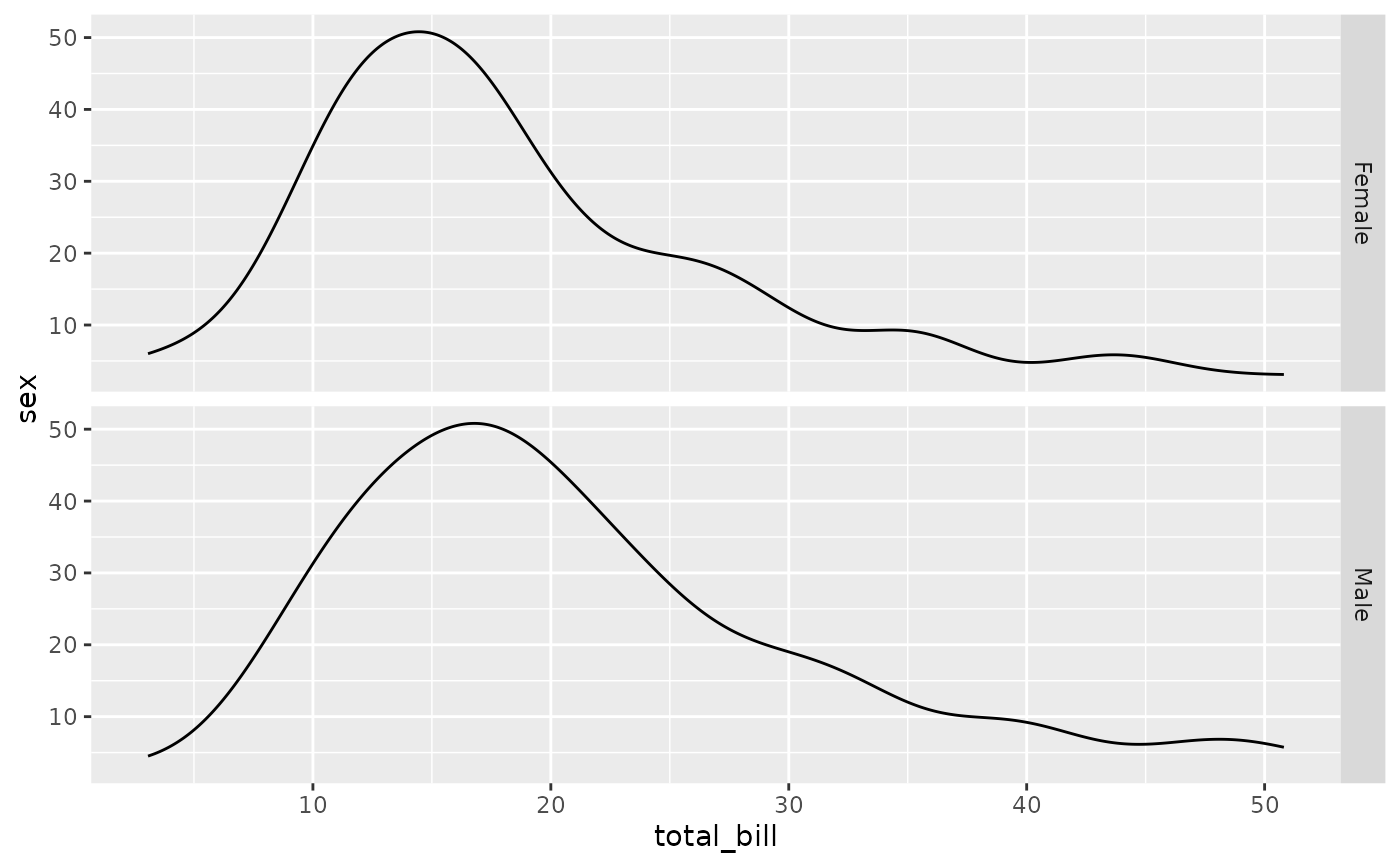
p_(ggally_facetdensity(tips, mapping = ggplot2::aes(x = total_bill, y = sex)))
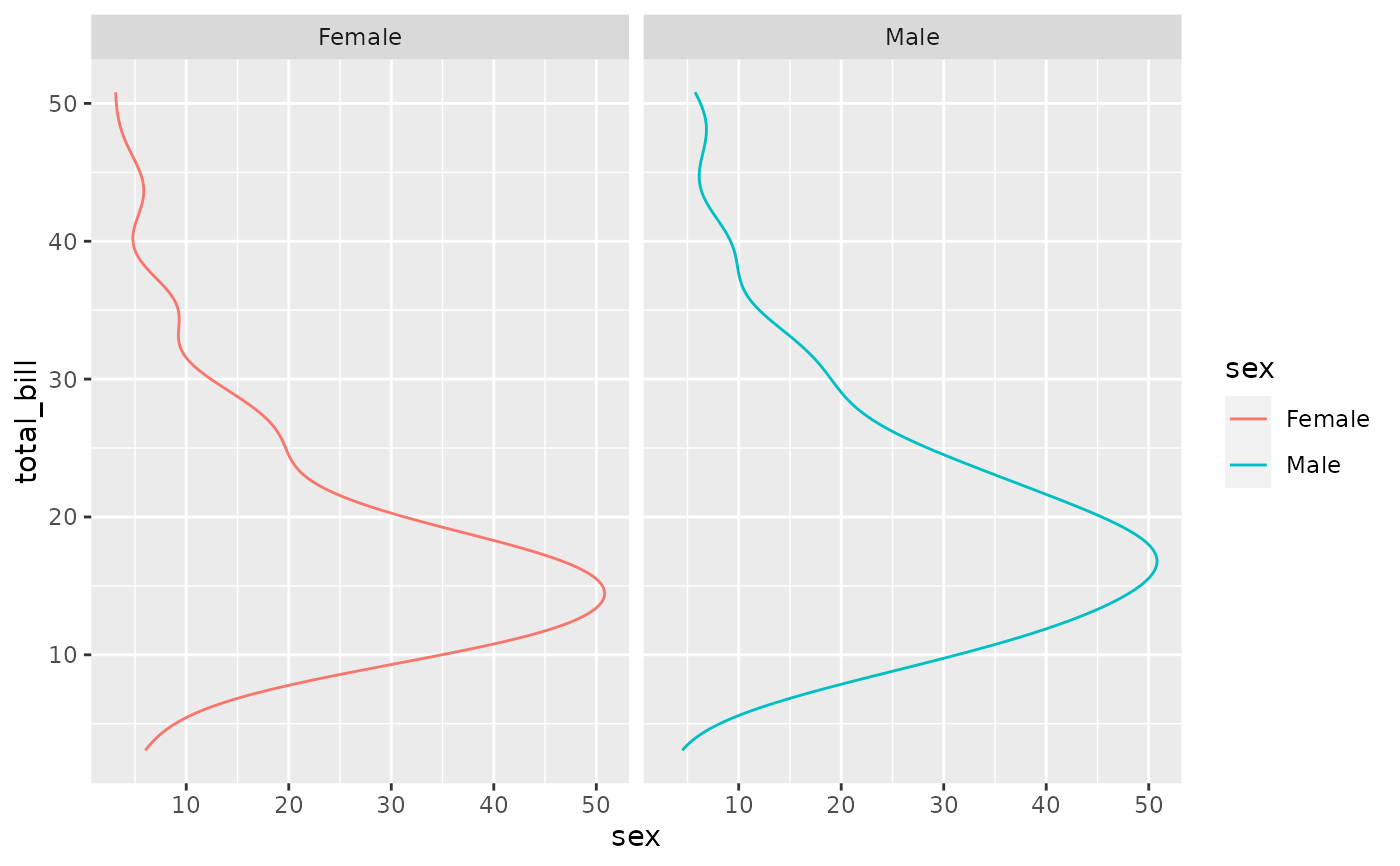
 p_(ggally_facetdensity(
tips,
mapping = ggplot2::aes(sex, total_bill, color = sex)
))
p_(ggally_facetdensity(
tips,
mapping = ggplot2::aes(sex, total_bill, color = sex)
))