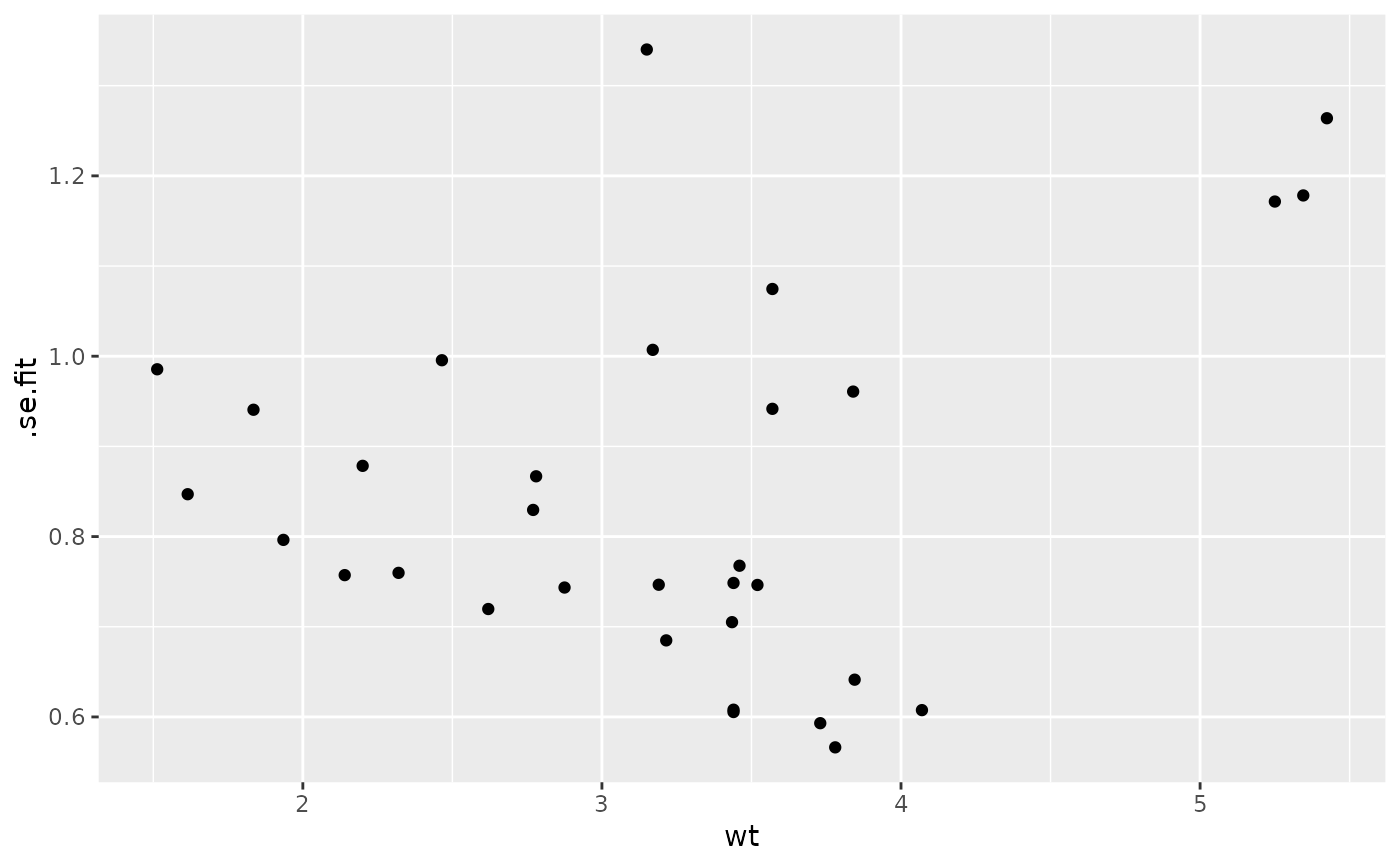
A function to display stats::predict's standard errors
Usage
ggally_nostic_se_fit(
  data,
  mapping,
  ...,
  lineColor = brew_colors("grey"),
  linePosition = NULL
)
Arguments
- data, mapping, ..., lineColor
parameters supplied to
ggally_nostic_line- linePosition
base comparison for a perfect fit
Details
As stated in stats::predict documentation:
If the logical 'se.fit' is 'TRUE', standard errors of the predictions are calculated. If the numeric argument 'scale' is set (with optional ”df'), it is used as the residual standard deviation in the computation of the standard errors, otherwise this is extracted from the model fit.
Since the se.fit is TRUE and scale is unset by default, the standard errors are extracted from the model fit.
A base line of 0 is added to give reference to a perfect fit.
Examples
# Small function to display plots only if it's interactive
p_ <- GGally::print_if_interactive

dt <- broomify(stats::lm(mpg ~ wt + qsec + am, data = mtcars))
p_(ggally_nostic_se_fit(dt, ggplot2::aes(wt, .se.fit)))