If non-null pVal and sigma values are given, confidence interval lines will be added to the plot at the specified pVal locations of a N(0, 1) distribution.
Arguments
- data, mapping, ...
parameters supplied to
ggally_nostic_resid- sigma
sigma value for the
pValpercentiles. Set to 1 for standardized residuals
Examples
# Small function to display plots only if it's interactive
p_ <- GGally::print_if_interactive
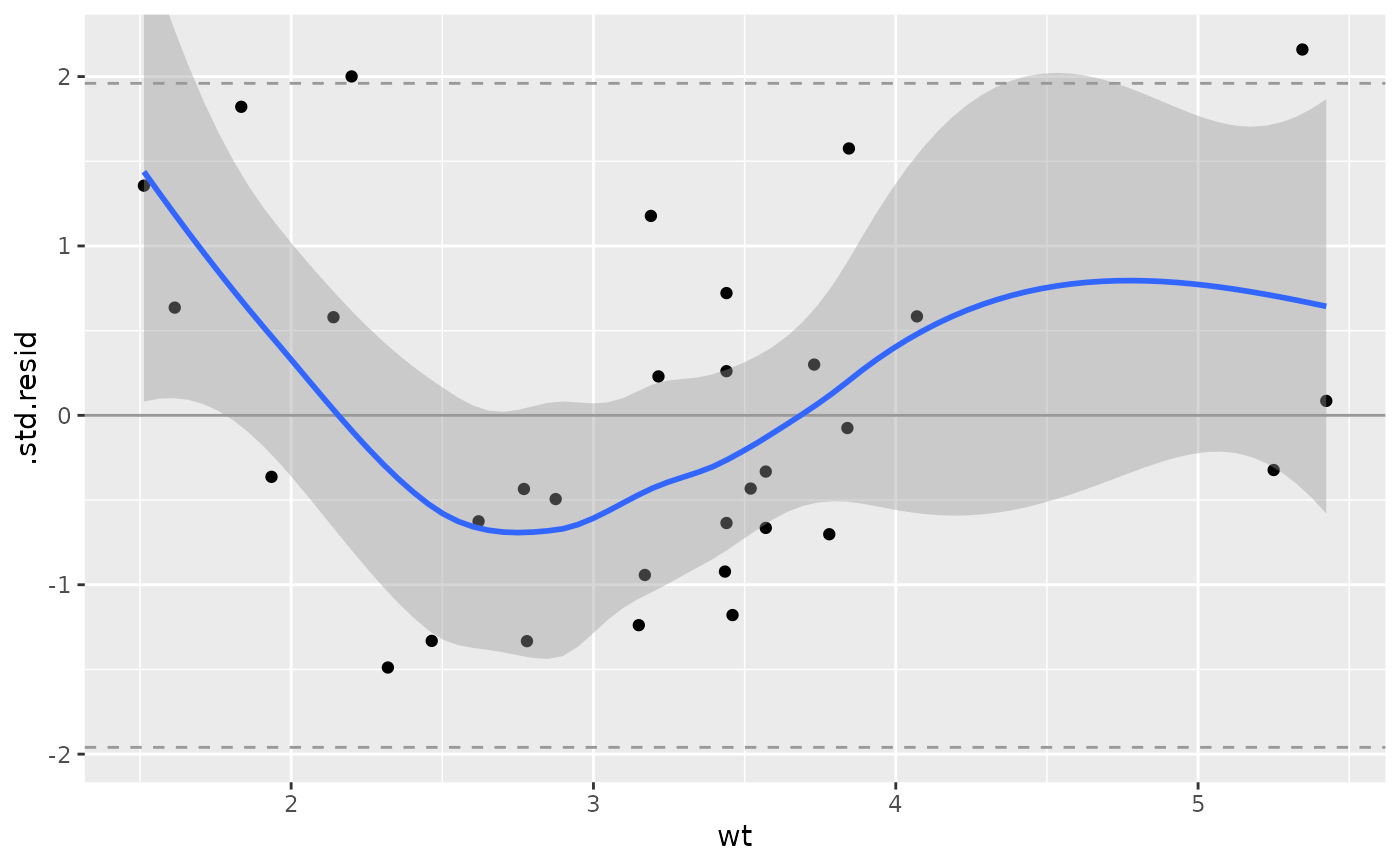
dt <- broomify(stats::lm(mpg ~ wt + qsec + am, data = mtcars))
p_(ggally_nostic_std_resid(dt, ggplot2::aes(wt, .std.resid)))
#> `geom_smooth()` using method = 'loess'