Plot the coefficients of a model with broom and ggplot2.
For an updated and improved version, see ggcoef_model().
Usage
ggcoef(
  x,
  mapping = aes(!!as.name("estimate"), !!as.name("term")),
  conf.int = TRUE,
  conf.level = 0.95,
  exponentiate = FALSE,
  exclude_intercept = FALSE,
  vline = TRUE,
  vline_intercept = "auto",
  vline_color = "gray50",
  vline_linetype = "dotted",
  vline_size = 1,
  errorbar_color = "gray25",
  errorbar_height = 0,
  errorbar_linetype = "solid",
  errorbar_size = 0.5,
  sort = c("none", "ascending", "descending"),
  ...
)
Arguments
- x
a model object to be tidied with
broom::tidy()or a data frame (see Details)- mapping
default aesthetic mapping
- conf.int
display confidence intervals as error bars?
- conf.level
level of confidence intervals (passed to
broom::tidy()ifxis not a data frame)- exponentiate
if
TRUE, x-axis will be logarithmic (also passed tobroom::tidy()ifxis not a data frame)- exclude_intercept
should the intercept be excluded from the plot?
- vline
print a vertical line?
- vline_intercept
xinterceptfor the vertical line."auto"forx = 0(orx = 1ifexponentiateisTRUE)- vline_color
color of the vertical line
- vline_linetype
line type of the vertical line
- vline_size
size of the vertical line
- errorbar_color
color of the error bars
- errorbar_height
height of the error bars
- errorbar_linetype
line type of the error bars
- errorbar_size
size of the error bars
- sort
"none"(default) do not sort,"ascending"sort by increasing coefficient value, or"descending"sort by decreasing coefficient value- ...
additional arguments sent to
ggplot2::geom_point()
Examples
# Small function to display plots only if it's interactive
p_ <- GGally::print_if_interactive
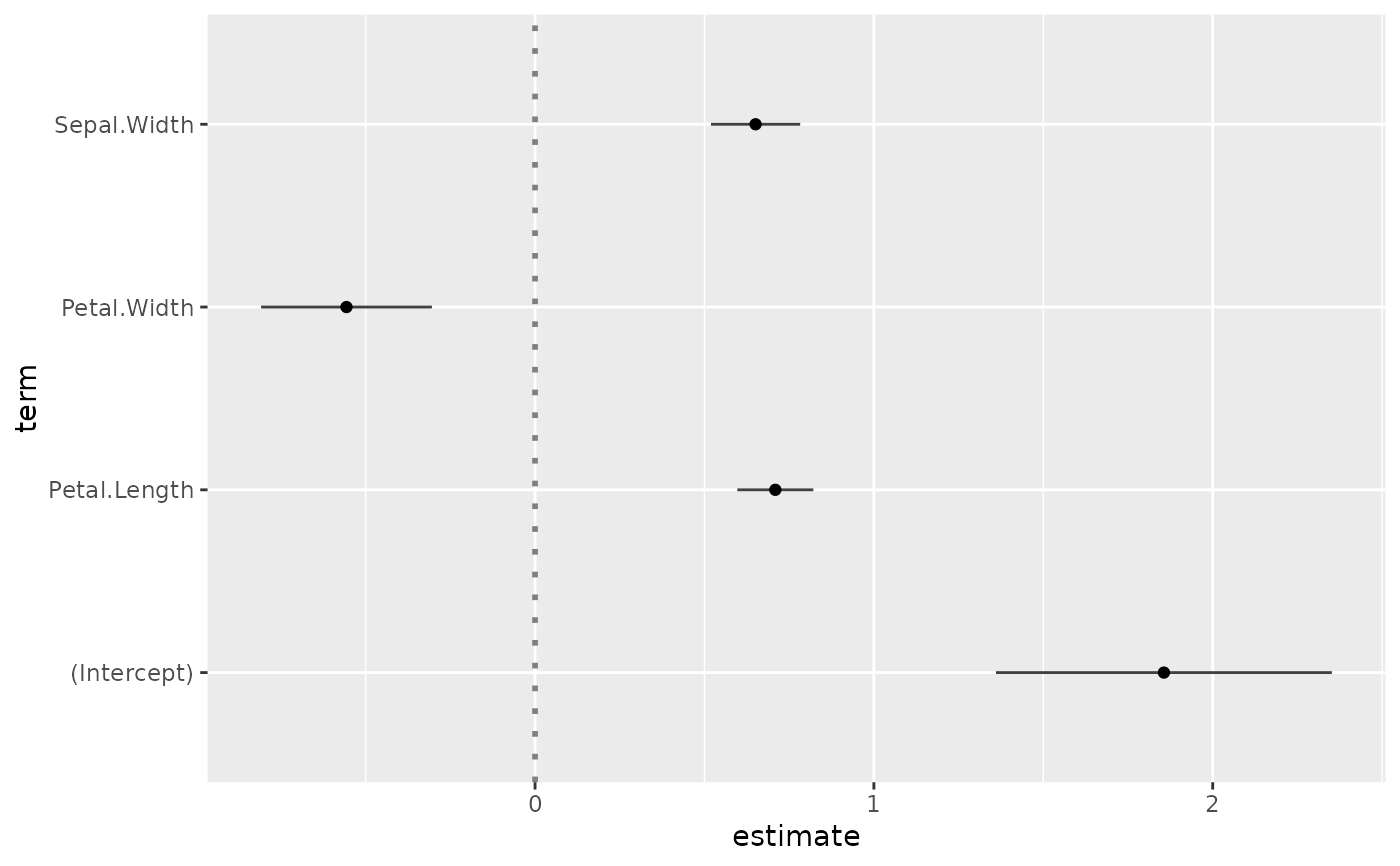
library(broom)
reg <- lm(Sepal.Length ~ Sepal.Width + Petal.Length + Petal.Width, data = iris)
p_(ggcoef(reg))
 # \donttest{
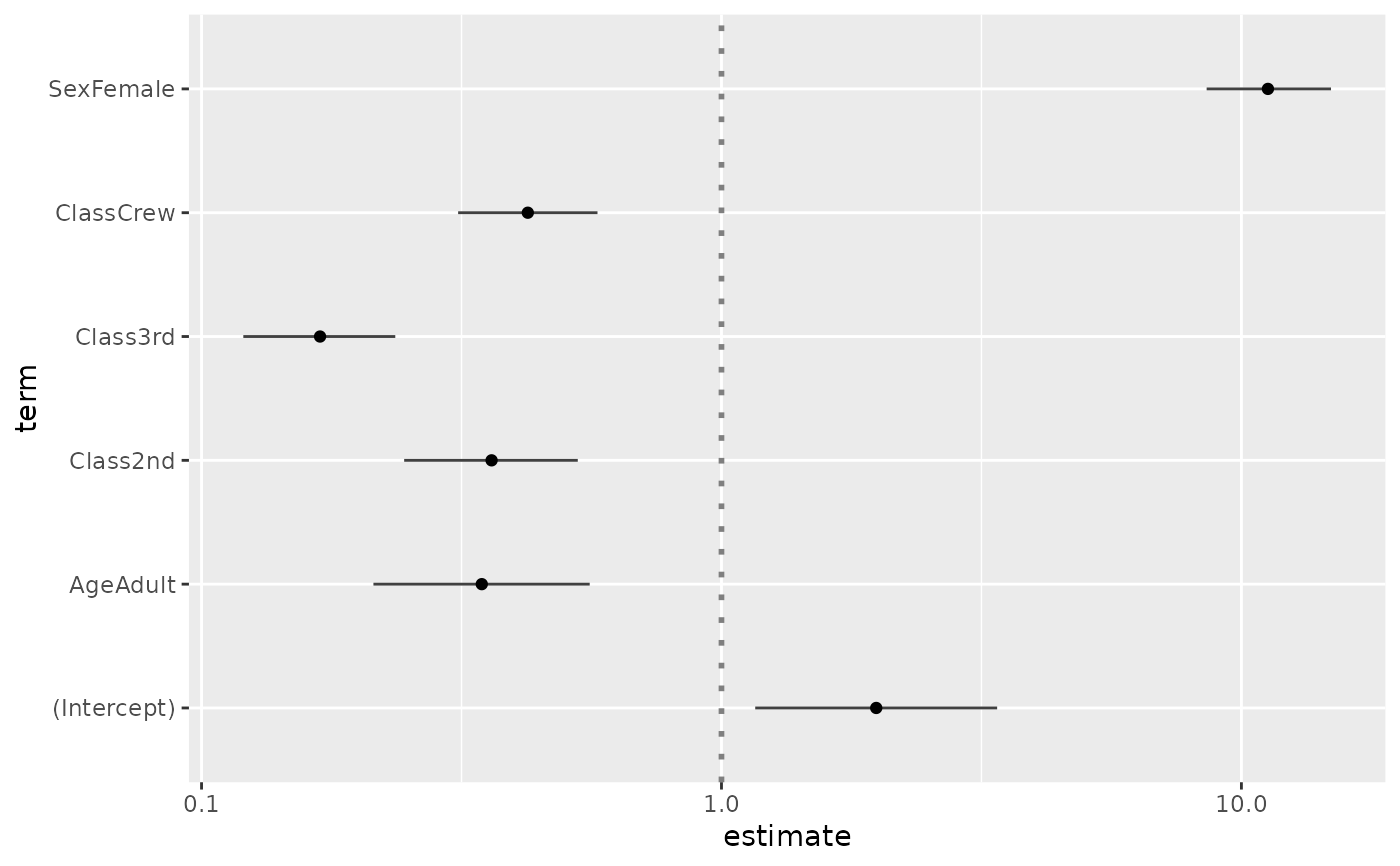
d <- as.data.frame(Titanic)
reg2 <- glm(Survived ~ Sex + Age + Class, family = binomial, data = d, weights = d$Freq)
ggcoef(reg2, exponentiate = TRUE)
# \donttest{
d <- as.data.frame(Titanic)
reg2 <- glm(Survived ~ Sex + Age + Class, family = binomial, data = d, weights = d$Freq)
ggcoef(reg2, exponentiate = TRUE)
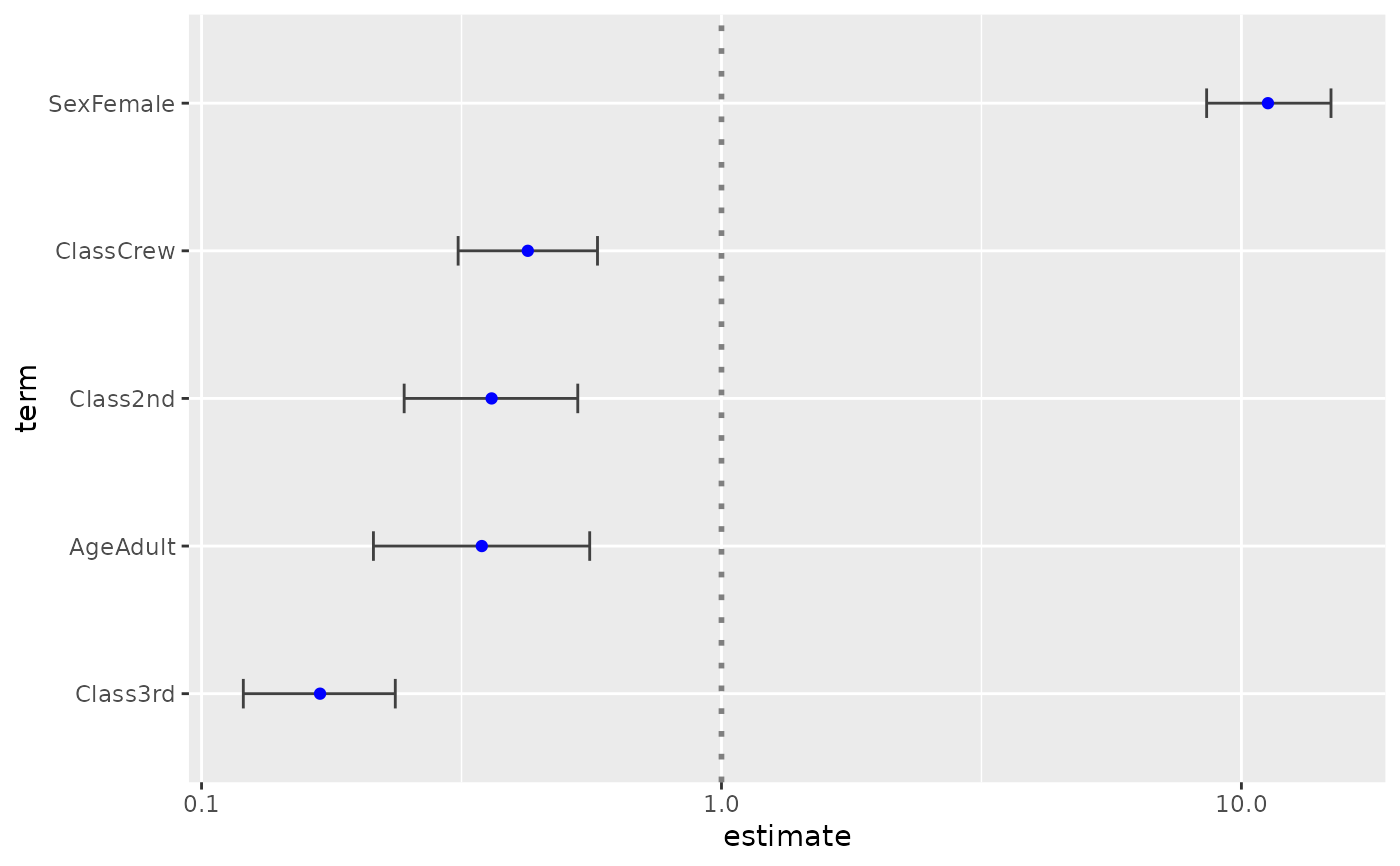
 ggcoef(
reg2,
exponentiate = TRUE, exclude_intercept = TRUE,
errorbar_height = .2, color = "blue", sort = "ascending"
)
ggcoef(
reg2,
exponentiate = TRUE, exclude_intercept = TRUE,
errorbar_height = .2, color = "blue", sort = "ascending"
)
 # }
# }