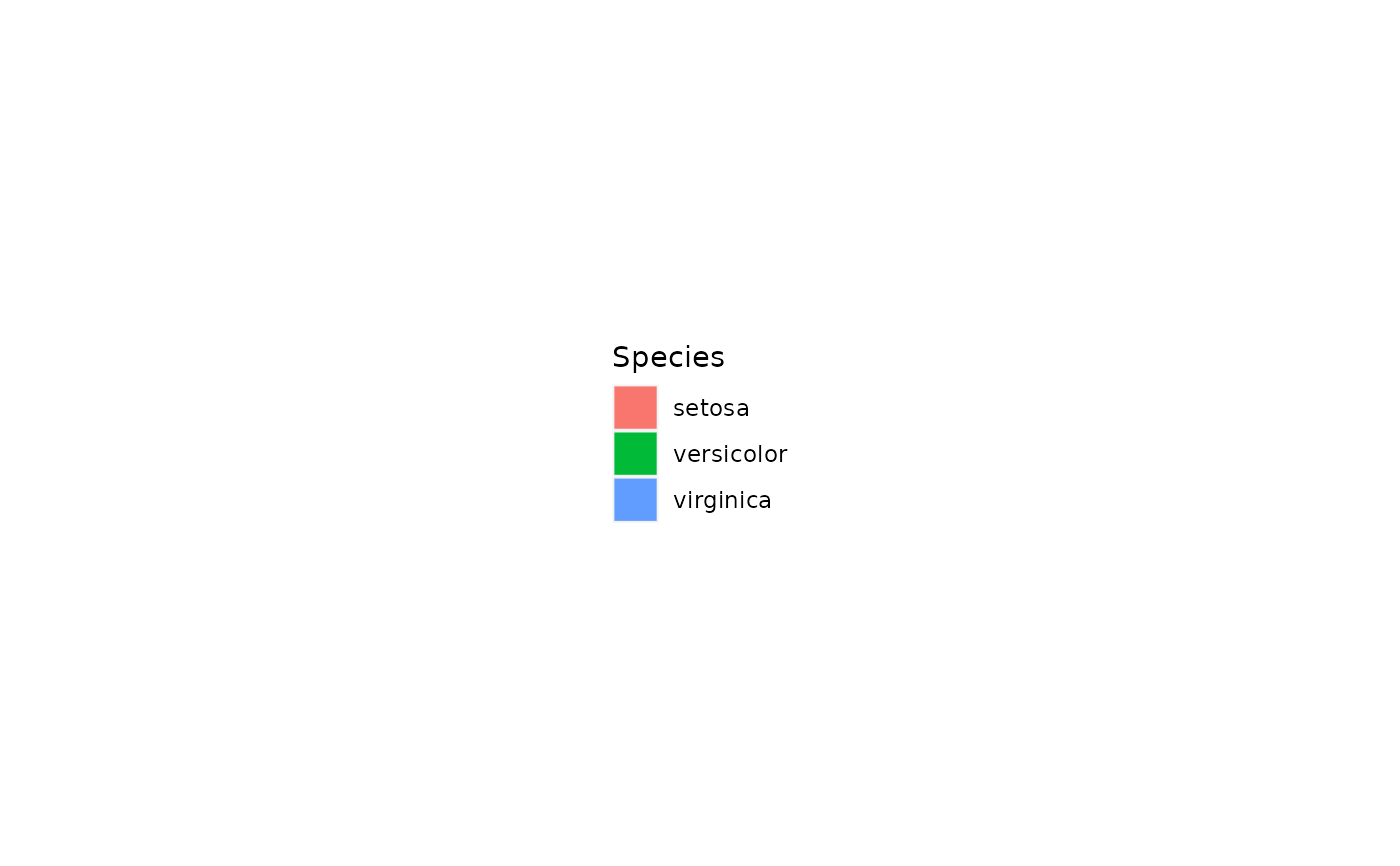
Grab the legend and print it as a plot
Usage
grab_legend(p)

# S3 method for class 'legend_guide_box'
print(x, ..., plotNew = FALSE)Examples
# Small function to display plots only if it's interactive
p_ <- GGally::print_if_interactive
library(ggplot2)
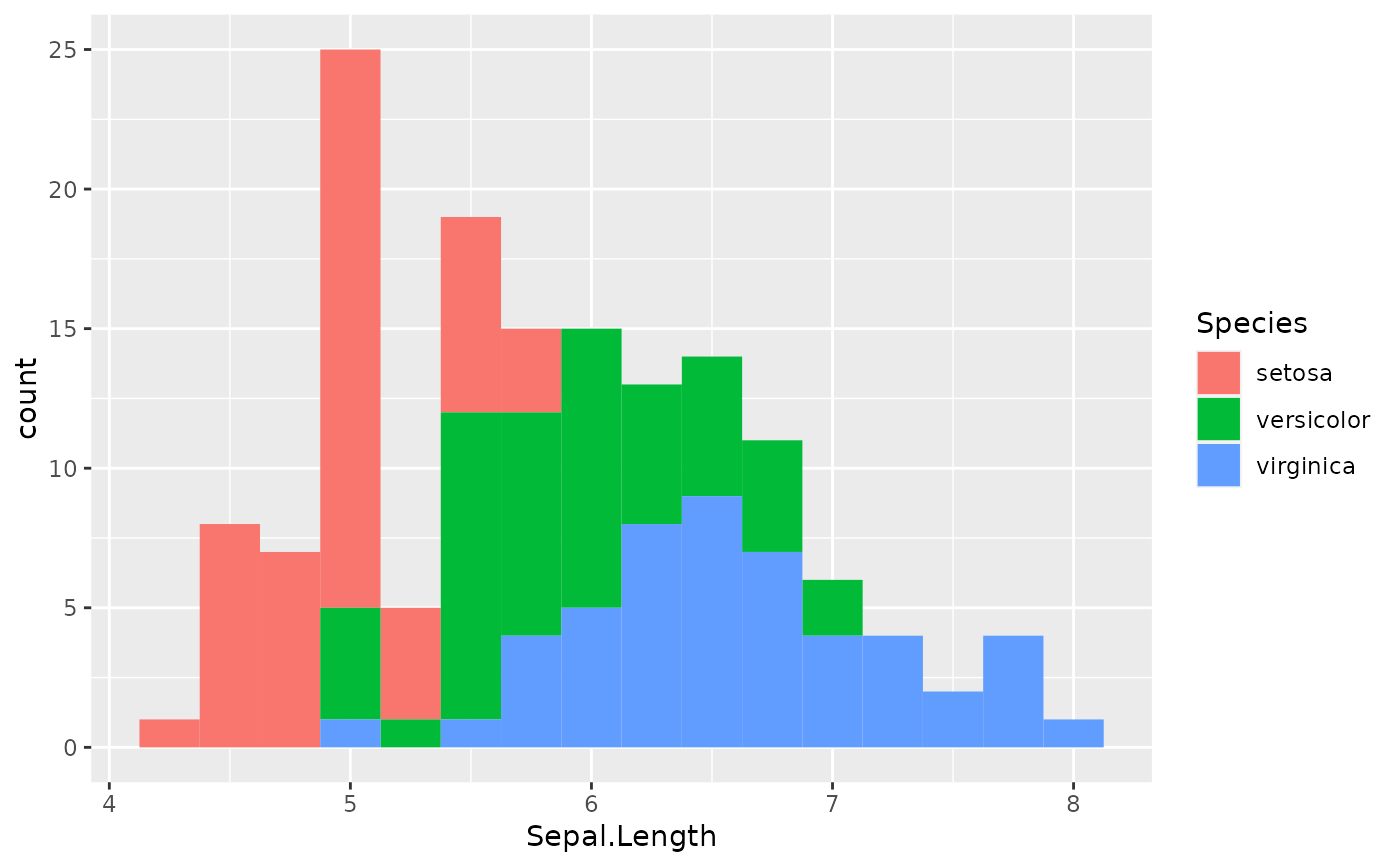
histPlot <-
ggplot(iris, aes(Sepal.Length, fill = Species)) +
geom_histogram(binwidth = 1 / 4)
(right <- histPlot)
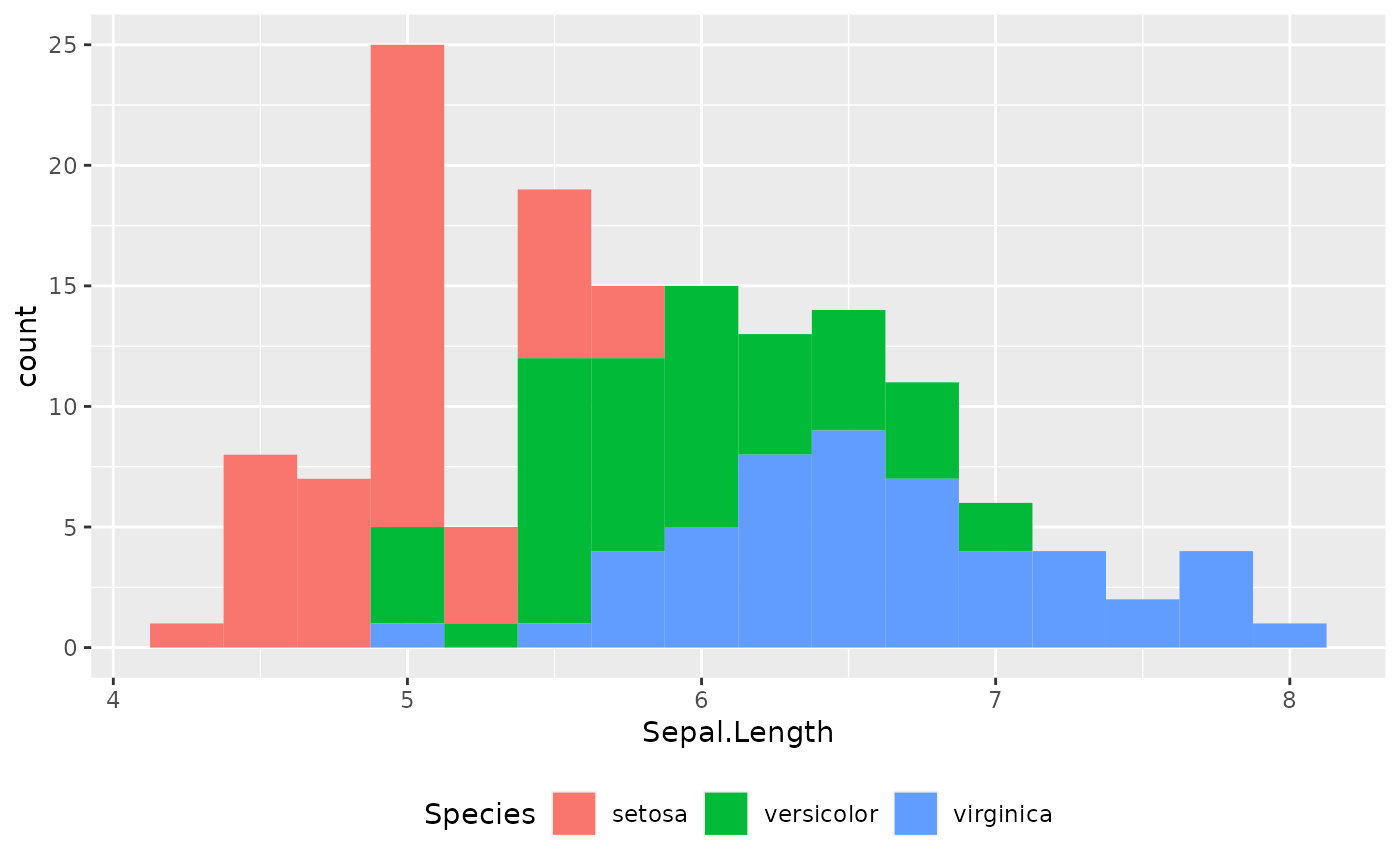
 (bottom <- histPlot + theme(legend.position = "bottom"))
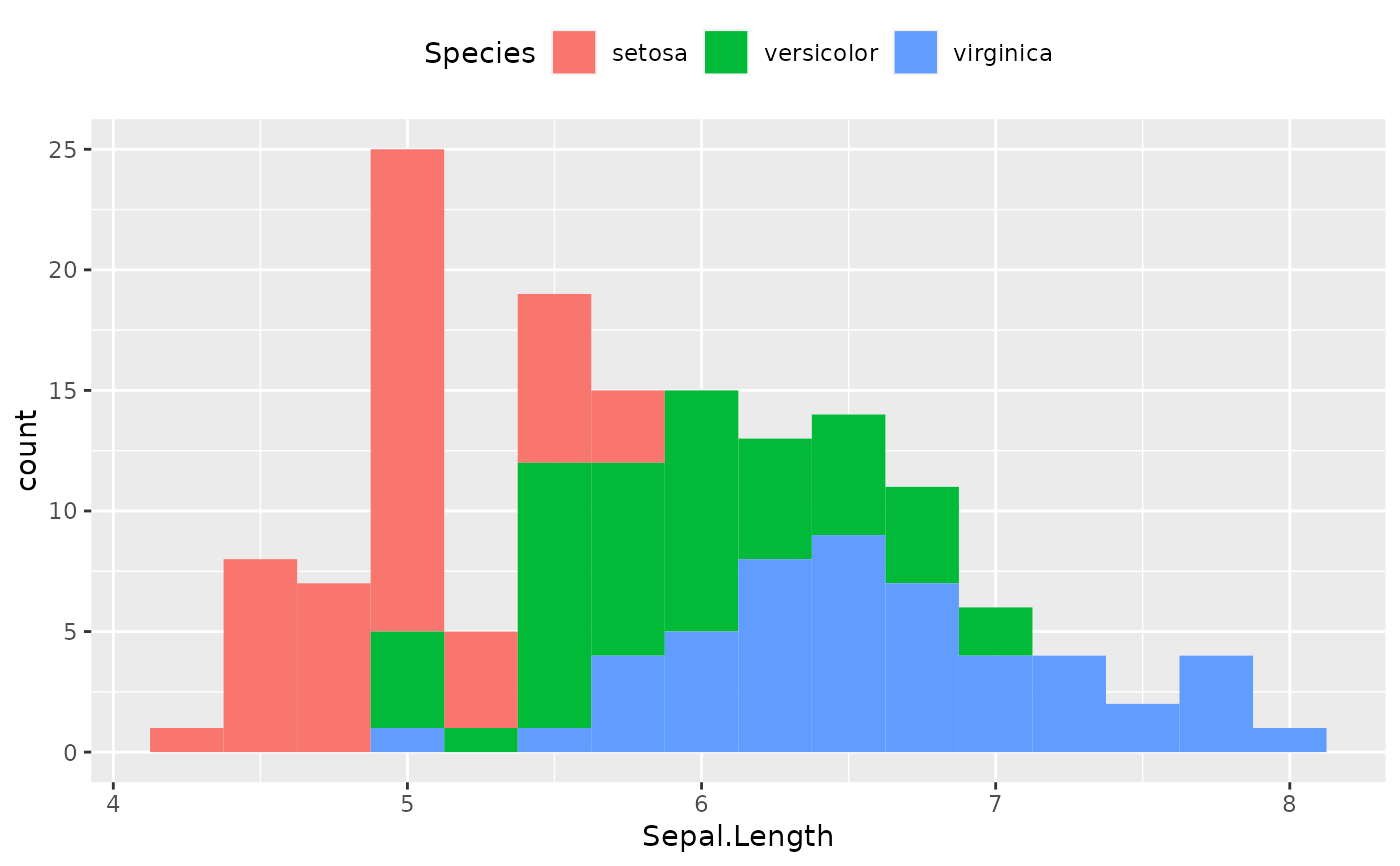
 (top <- histPlot + theme(legend.position = "top"))
 (left <- histPlot + theme(legend.position = "left"))
p_(grab_legend(right))
p_(grab_legend(bottom))
p_(grab_legend(top))
p_(grab_legend(left))
(left <- histPlot + theme(legend.position = "left"))
p_(grab_legend(right))
p_(grab_legend(bottom))
p_(grab_legend(top))
p_(grab_legend(left))