Plots the lowertriangle and density plots of the scatter plot matrix.
Source:R/ggscatmat.R
scatmat.RdFunction for making scatterplots in the lower triangle and diagonal density plots.
Usage
scatmat(data, columns = 1:ncol(data), color = NULL, alpha = 1)Arguments
- data
a data matrix. Should contain numerical (continuous) data.
- columns
an option to choose the column to be used in the raw dataset. Defaults to
1:ncol(data)- color
an option to group the dataset by the factor variable and color them by different colors. Defaults to
NULL- alpha
an option to set the transparency in scatterplots for large data. Defaults to
1.
Examples
# small function to display plots only if it's interactive
p_ <- GGally::print_if_interactive
data(flea)
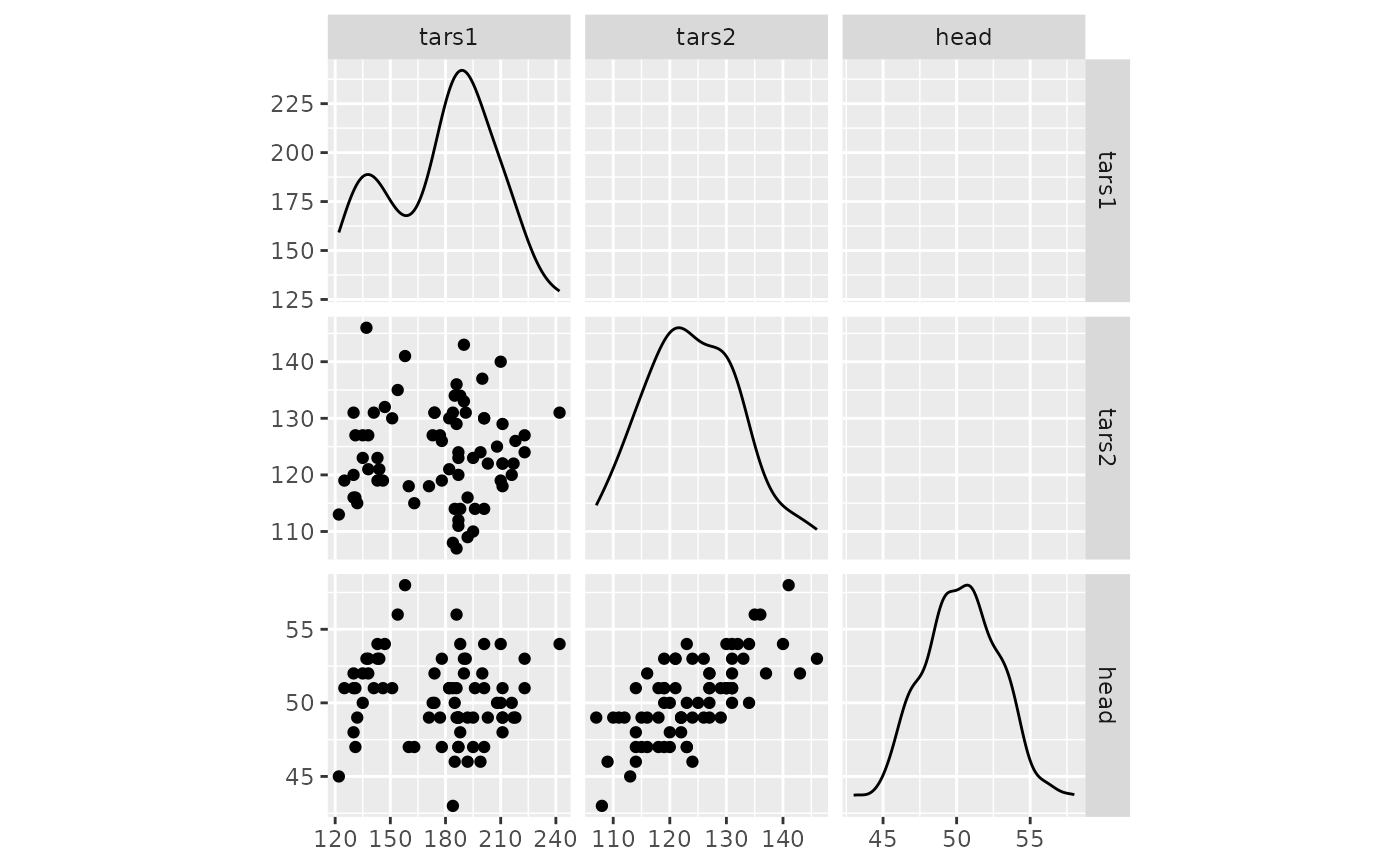
p_(scatmat(flea, columns = 2:4))
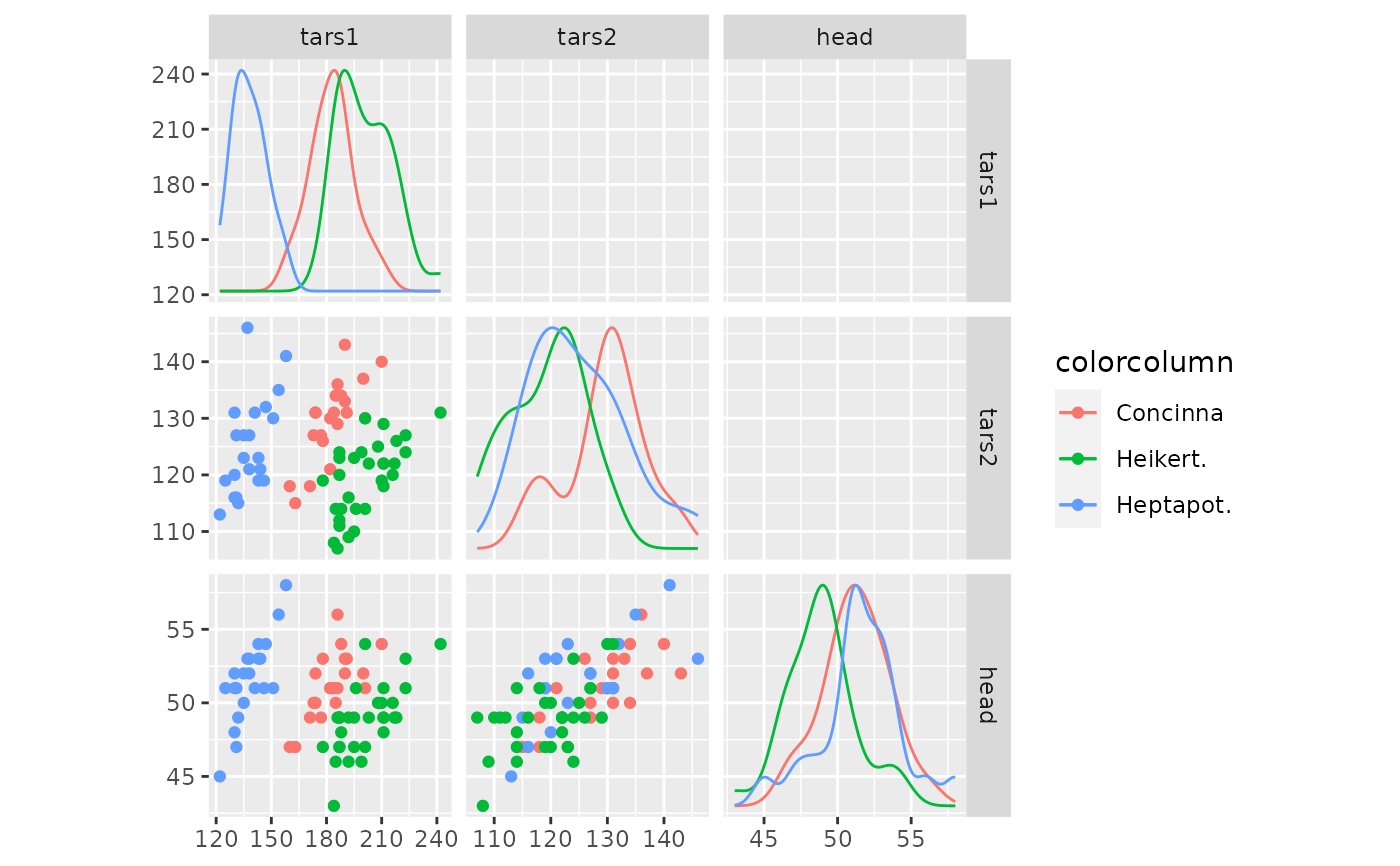
 p_(scatmat(flea, columns = 2:4, color = "species"))