Displays a bar plot for the diagonal of a ggpairs plot matrix.
Examples
# Small function to display plots only if it's interactive
p_ <- GGally::print_if_interactive
data(tips)
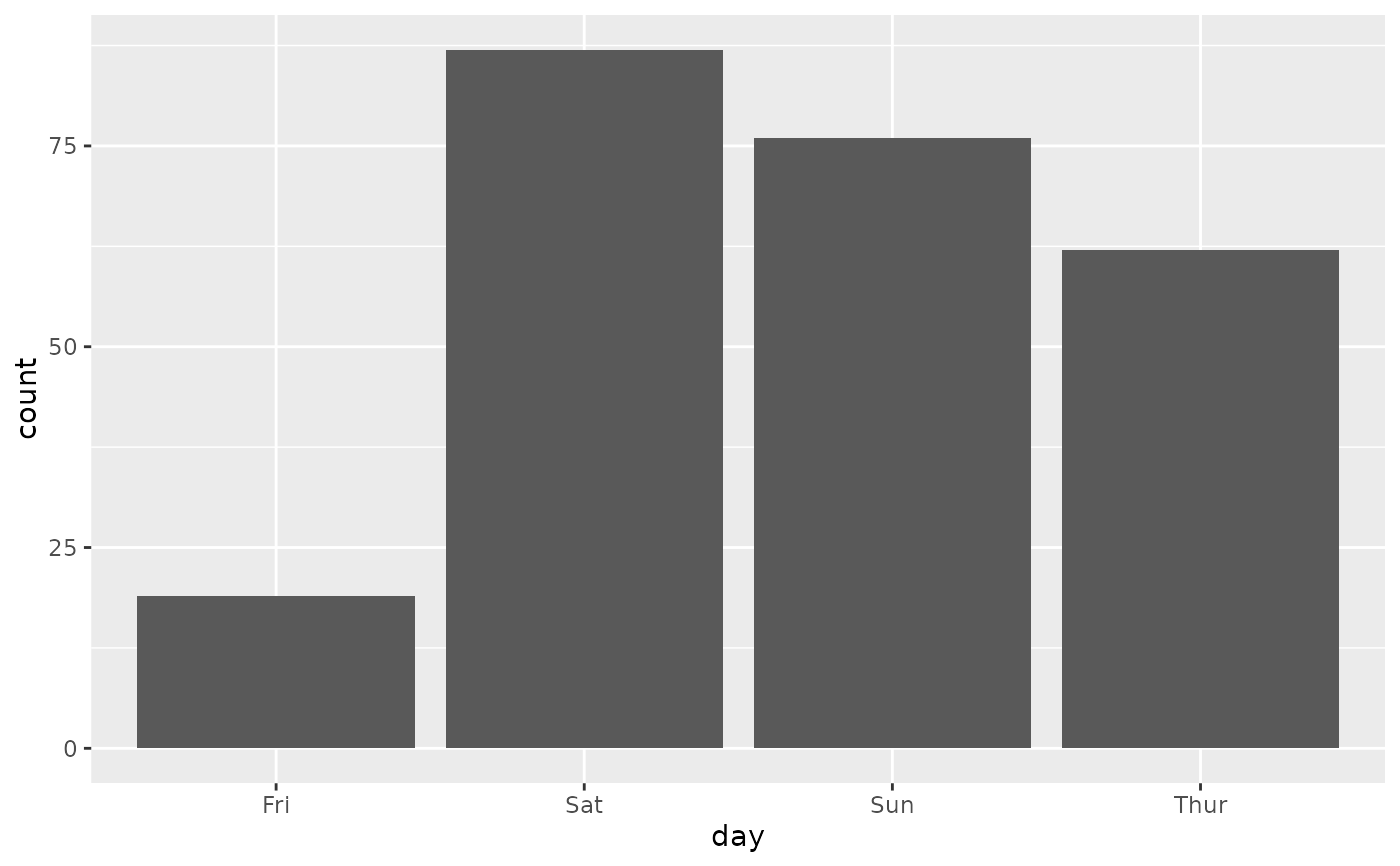
p_(ggally_barDiag(tips, mapping = ggplot2::aes(x = day)))
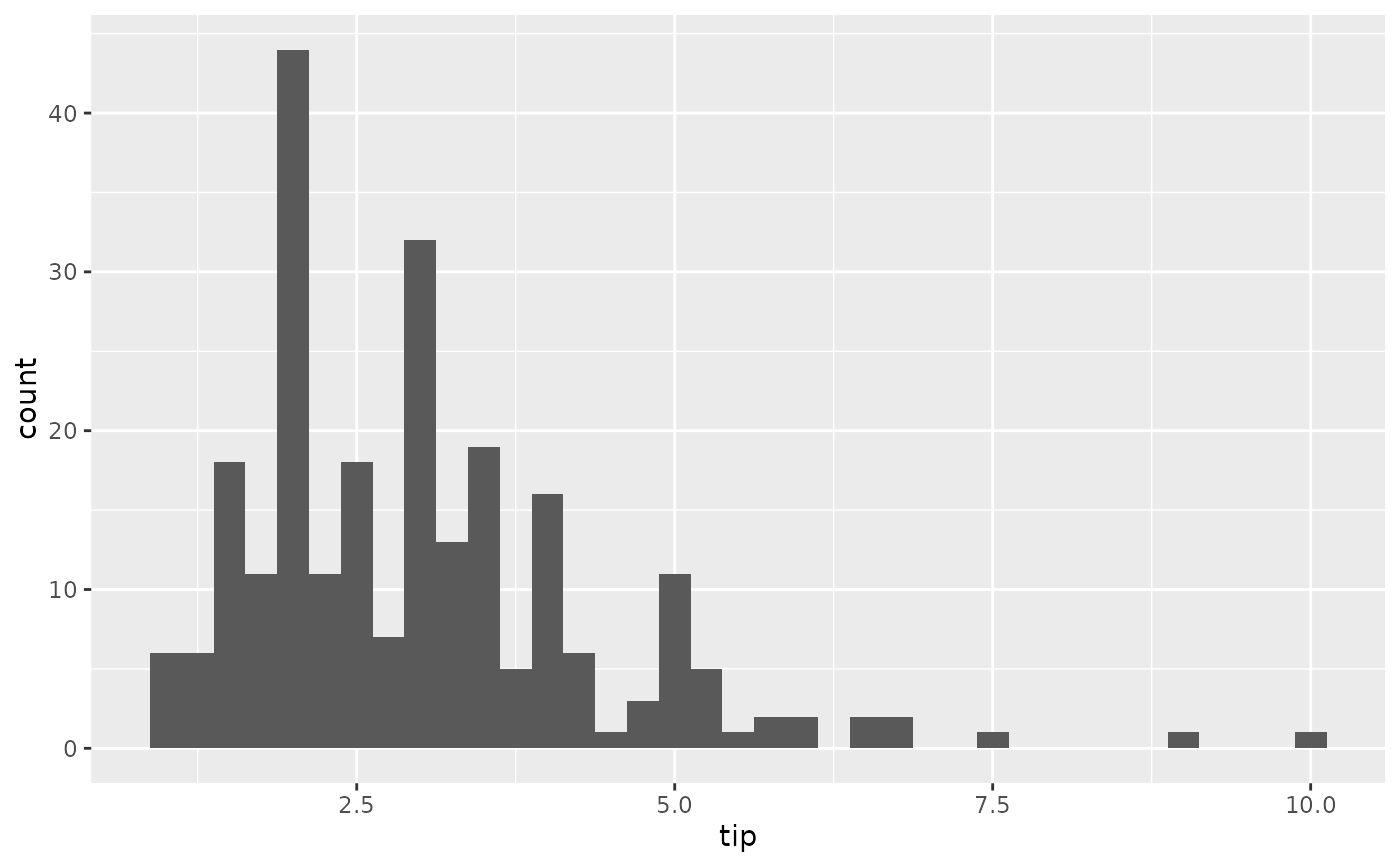
 p_(ggally_barDiag(tips, mapping = ggplot2::aes(x = tip), binwidth = 0.25))