Make a matrix of plots with a given data set
Usage
ggpairs(
  data,
  mapping = NULL,
  columns = 1:ncol(data),
  title = NULL,
  upper = list(continuous = "cor", combo = "box_no_facet", discrete = "count", na = "na"),
  lower = list(continuous = "points", combo = "facethist", discrete = "facetbar", na =
    "na"),
  diag = list(continuous = "densityDiag", discrete = "barDiag", na = "naDiag"),
  params = deprecated(),
  ...,
  xlab = NULL,
  ylab = NULL,
  axisLabels = c("show", "internal", "none"),
  columnLabels = colnames(data[columns]),
  labeller = "label_value",
  switch = NULL,
  showStrips = NULL,
  legend = NULL,
  cardinality_threshold = 15,
  progress = NULL,
  proportions = NULL,
  legends = deprecated()
)
Arguments
- data
data set using. Can have both numerical and categorical data.
- mapping
aesthetic mapping (besides
xandy). Seeaes(). Ifmappingis numeric,columnswill be set to themappingvalue andmappingwill be set toNULL.- columns
which columns are used to make plots. Defaults to all columns.
- title, xlab, ylab
title, x label, and y label for the graph
- upper
see Details
- lower
see Details
- diag
see Details
- params
- ...
![[Deprecated]](figures/lifecycle-deprecated.svg) use
use mapping- axisLabels
either "show" to display axisLabels, "internal" for labels in the diagonal plots, or "none" for no axis labels
- columnLabels
label names to be displayed. Defaults to names of columns being used.
- labeller
labeller for facets. See
labellers. Common values are"label_value"(default) and"label_parsed".- switch
switch parameter for facet_grid. See
ggplot2::facet_grid. By default, the labels are displayed on the top and right of the plot. If"x", the top labels will be displayed to the bottom. If"y", the right-hand side labels will be displayed to the left. Can also be set to"both"- showStrips
boolean to determine if each plot's strips should be displayed.
NULLwill default to the top and right side plots only.TRUEorFALSEwill turn all strips on or off respectively.- legend
May be the two objects described below or the default
NULLvalue. The legend position can be moved by using ggplot2's theme elementpm + theme(legend.position = "bottom")- a single numeric value
provides the location of a plot according to the display order. Such as
legend = 3in a plot matrix with 2 rows and 5 columns displayed by column will return the plot in positionc(1,2)- a object from
grab_legend() a predetermined plot legend that will be displayed directly
- cardinality_threshold
maximum number of levels allowed in a character / factor column. Set this value to NULL to not check factor columns. Defaults to 15
- progress
NULL(default) for a progress bar in interactive sessions with more than 15 plots,TRUEfor a progress bar,FALSEfor no progress bar, or a function that accepts at least a plot matrix and returns a newprogress::progress_bar. Seeggmatrix_progress.- proportions
Value to change how much area is given for each plot. Either
NULL(default), numeric value matching respective length,grid::unitobject with matching respective length or"auto"for automatic relative proportions based on the number of levels for categorical variables.- legends
Value
ggmatrix object that if called, will print
Details
upper and lower are lists that may contain the variables
'continuous', 'combo', 'discrete', and 'na'. Each element of the list may be a function or a string. If a string is supplied, it must be a character string representing the tail end of a ggally_NAME function. The list of current valid ggally_NAME functions is visible in a dedicated vignette.
- continuous
This option is used for continuous X and Y data.
- combo
This option is used for either continuous X and categorical Y data or categorical X and continuous Y data.
- discrete
This option is used for categorical X and Y data.
- na
This option is used when all X data is
NA, all Y data isNA, or either all X or Y data isNA.
diag is a list that may only contain the variables 'continuous', 'discrete', and 'na'. Each element of the diag list is a string implementing the following options:
- continuous
exactly one of ('densityDiag', 'barDiag', 'blankDiag'). This option is used for continuous X data.
- discrete
exactly one of ('barDiag', 'blankDiag'). This option is used for categorical X and Y data.
- na
exactly one of ('naDiag', 'blankDiag'). This option is used when all X data is
NA.
If 'blank' is ever chosen as an option, then ggpairs will produce an empty plot.
If a function is supplied as an option to upper, lower, or diag, it should implement the function api of function(data, mapping, ...){#make ggplot2 plot}. If a specific function needs its parameters set, wrap(fn, param1 = val1, param2 = val2) the function with its parameters.
References
John W Emerson, Walton A Green, Barret Schloerke, Jason Crowley, Dianne Cook, Heike Hofmann, Hadley Wickham. The Generalized Pairs Plot. Journal of Computational and Graphical Statistics, vol. 22, no. 1, pp. 79-91, 2012.
Examples
# small function to display plots only if it's interactive
p_ <- GGally::print_if_interactive
## Quick example, with and without colour
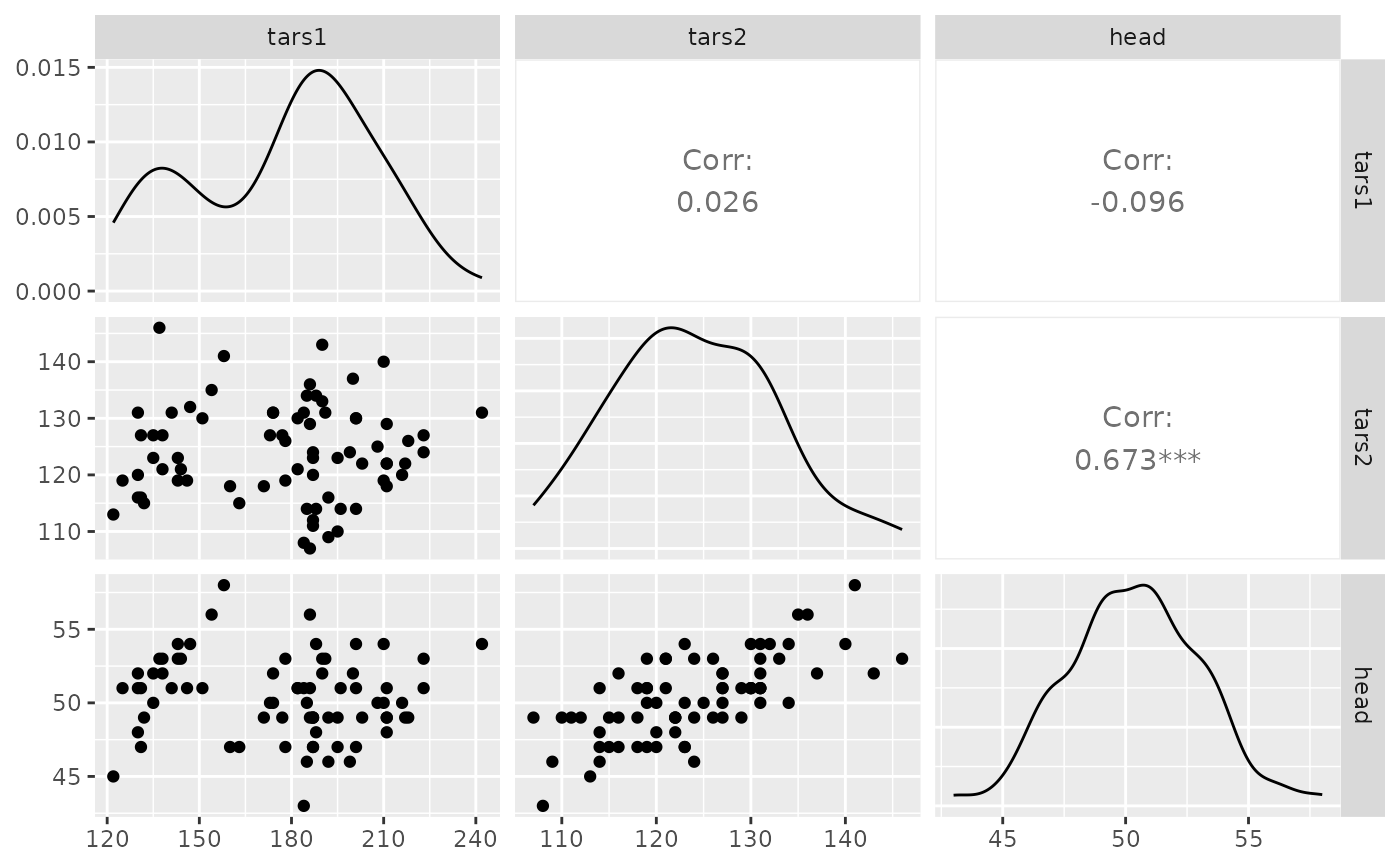
data(flea)
ggpairs(flea, columns = 2:4)
 pm <- ggpairs(flea, columns = 2:4, ggplot2::aes(colour = species))
p_(pm)
pm <- ggpairs(flea, columns = 2:4, ggplot2::aes(colour = species))
p_(pm)
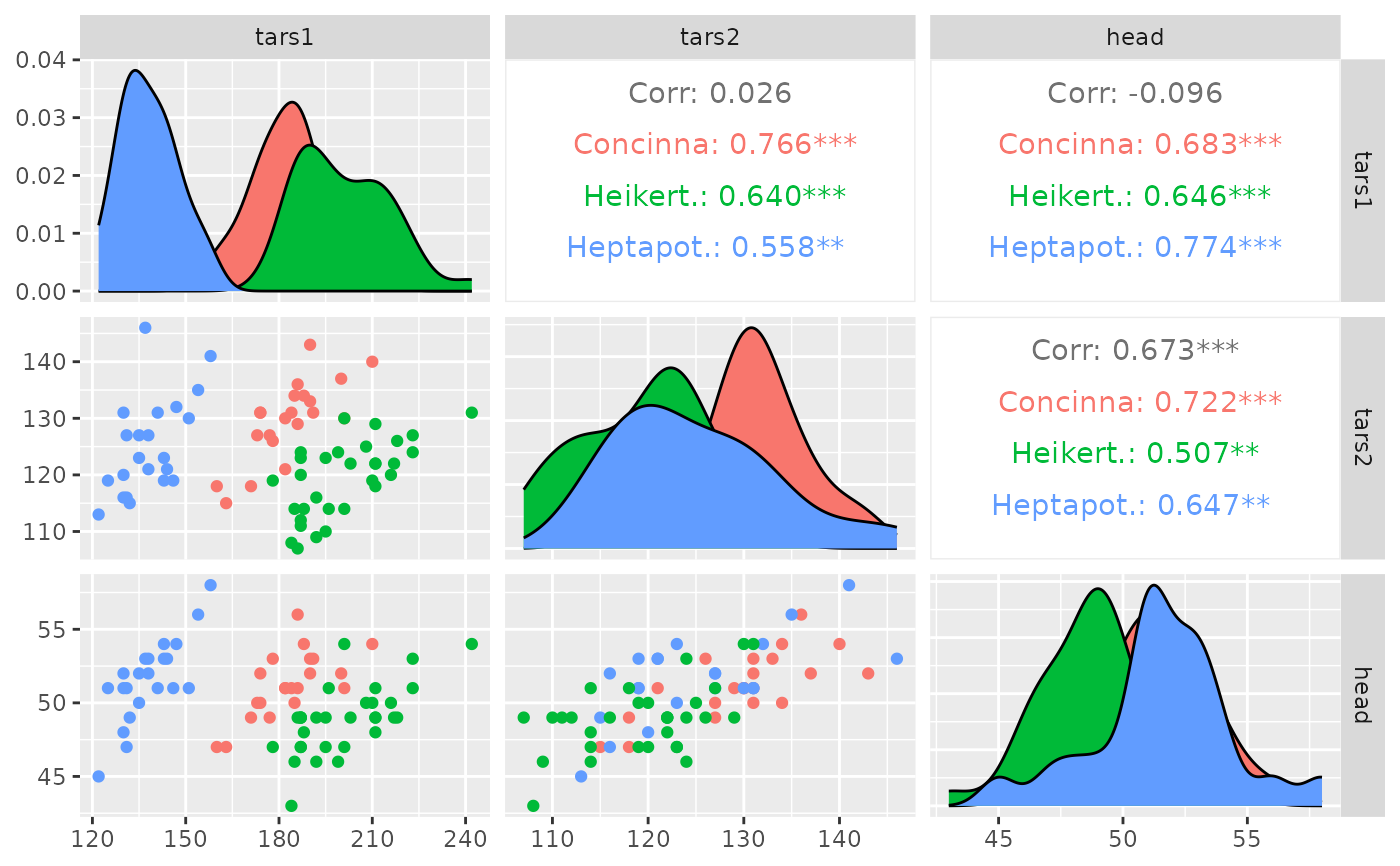 # Note: colour should be categorical, else you will need to reset
# the upper triangle to use points instead of trying to compute corr
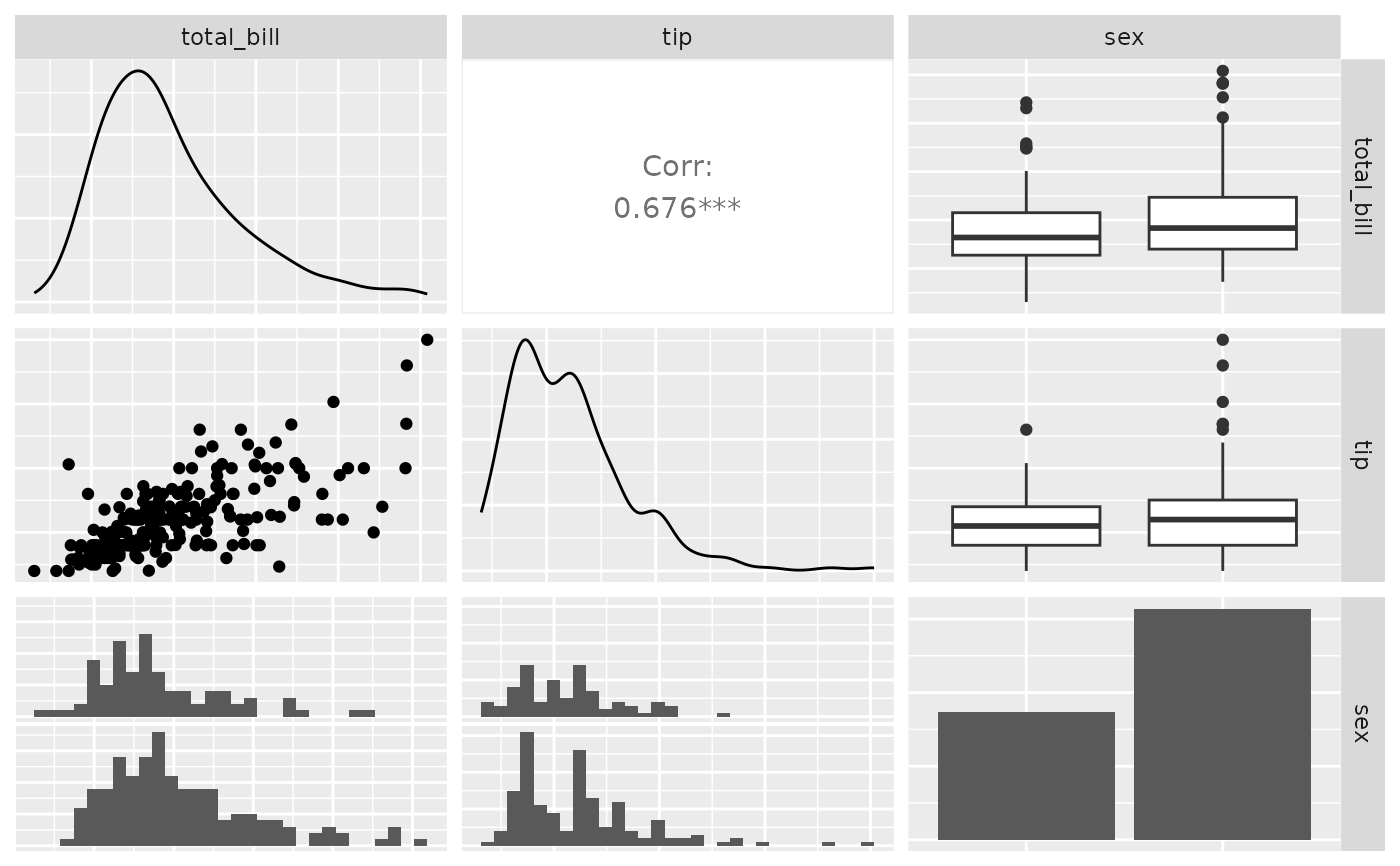
data(tips)
pm <- ggpairs(tips[, 1:3])
p_(pm)
#> `stat_bin()` using `bins = 30`. Pick better value with `binwidth`.
#> `stat_bin()` using `bins = 30`. Pick better value with `binwidth`.
# Note: colour should be categorical, else you will need to reset
# the upper triangle to use points instead of trying to compute corr
data(tips)
pm <- ggpairs(tips[, 1:3])
p_(pm)
#> `stat_bin()` using `bins = 30`. Pick better value with `binwidth`.
#> `stat_bin()` using `bins = 30`. Pick better value with `binwidth`.
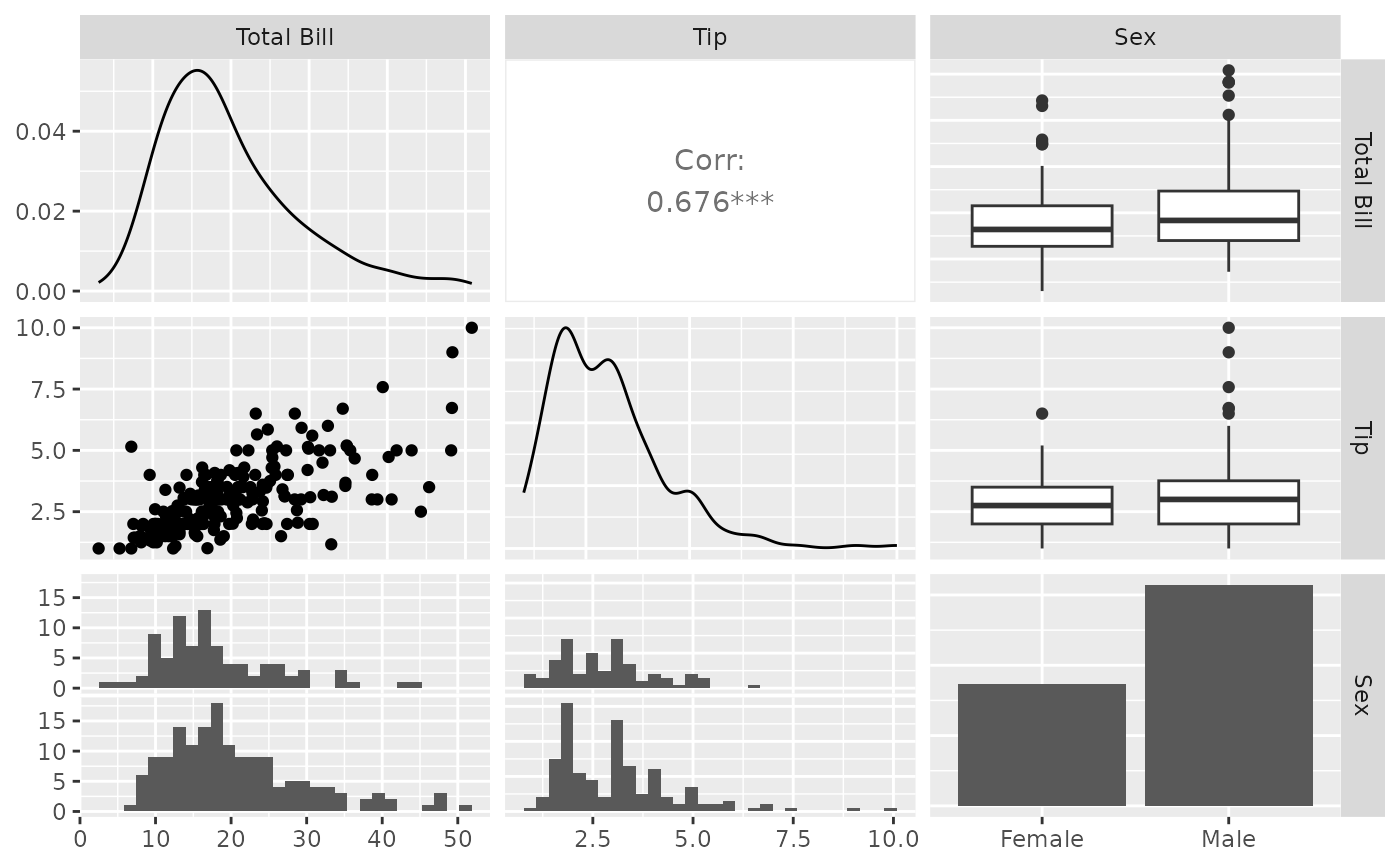
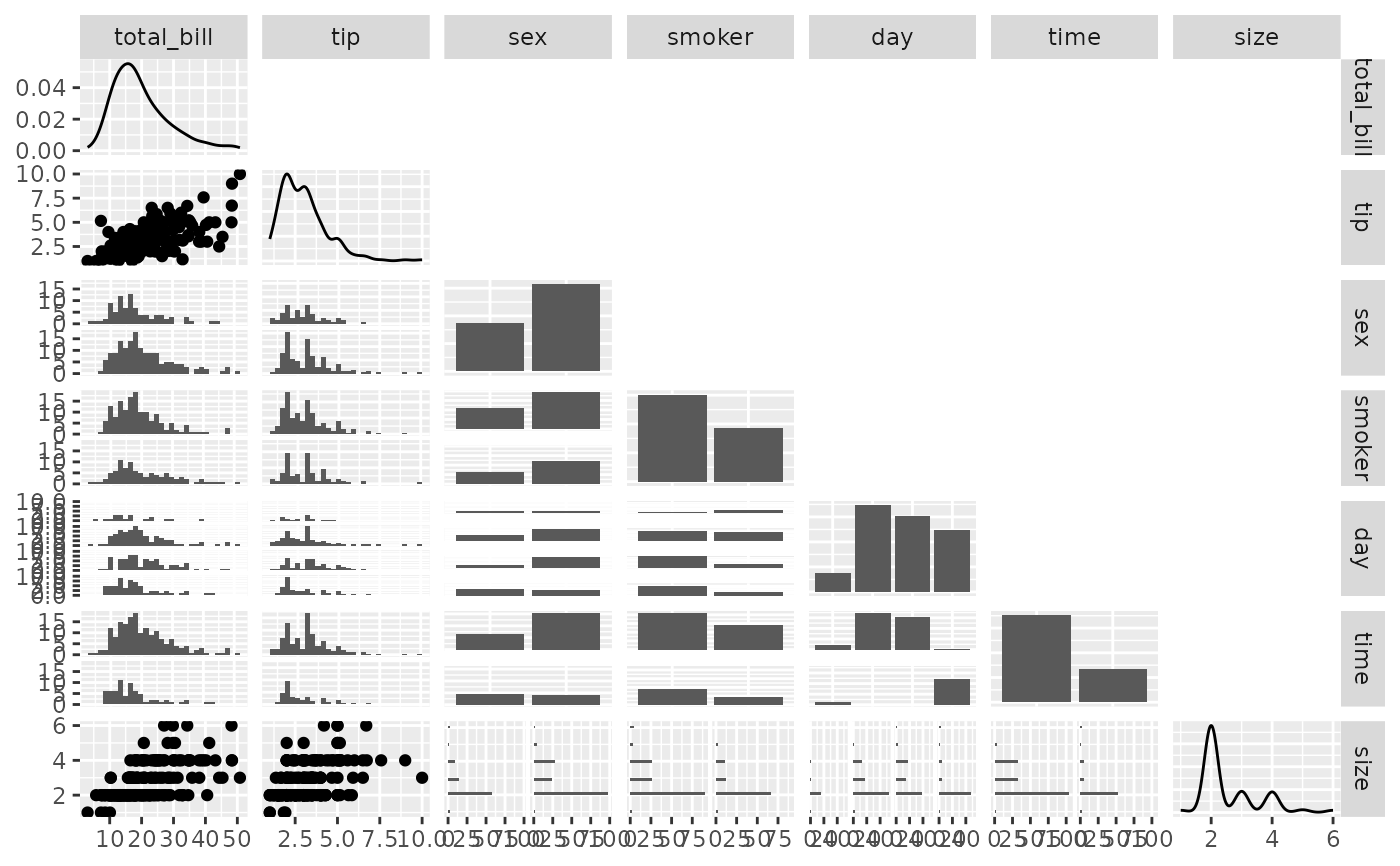
 pm <- ggpairs(tips, 1:3, columnLabels = c("Total Bill", "Tip", "Sex"))
p_(pm)
#> `stat_bin()` using `bins = 30`. Pick better value with `binwidth`.
#> `stat_bin()` using `bins = 30`. Pick better value with `binwidth`.
pm <- ggpairs(tips, 1:3, columnLabels = c("Total Bill", "Tip", "Sex"))
p_(pm)
#> `stat_bin()` using `bins = 30`. Pick better value with `binwidth`.
#> `stat_bin()` using `bins = 30`. Pick better value with `binwidth`.
 pm <- ggpairs(tips, upper = "blank")
p_(pm)
#> `stat_bin()` using `bins = 30`. Pick better value with `binwidth`.
#> `stat_bin()` using `bins = 30`. Pick better value with `binwidth`.
#> `stat_bin()` using `bins = 30`. Pick better value with `binwidth`.
#> `stat_bin()` using `bins = 30`. Pick better value with `binwidth`.
#> `stat_bin()` using `bins = 30`. Pick better value with `binwidth`.
#> `stat_bin()` using `bins = 30`. Pick better value with `binwidth`.
#> `stat_bin()` using `bins = 30`. Pick better value with `binwidth`.
#> `stat_bin()` using `bins = 30`. Pick better value with `binwidth`.
#> `stat_bin()` using `bins = 30`. Pick better value with `binwidth`.
#> `stat_bin()` using `bins = 30`. Pick better value with `binwidth`.
#> `stat_bin()` using `bins = 30`. Pick better value with `binwidth`.
#> `stat_bin()` using `bins = 30`. Pick better value with `binwidth`.
pm <- ggpairs(tips, upper = "blank")
p_(pm)
#> `stat_bin()` using `bins = 30`. Pick better value with `binwidth`.
#> `stat_bin()` using `bins = 30`. Pick better value with `binwidth`.
#> `stat_bin()` using `bins = 30`. Pick better value with `binwidth`.
#> `stat_bin()` using `bins = 30`. Pick better value with `binwidth`.
#> `stat_bin()` using `bins = 30`. Pick better value with `binwidth`.
#> `stat_bin()` using `bins = 30`. Pick better value with `binwidth`.
#> `stat_bin()` using `bins = 30`. Pick better value with `binwidth`.
#> `stat_bin()` using `bins = 30`. Pick better value with `binwidth`.
#> `stat_bin()` using `bins = 30`. Pick better value with `binwidth`.
#> `stat_bin()` using `bins = 30`. Pick better value with `binwidth`.
#> `stat_bin()` using `bins = 30`. Pick better value with `binwidth`.
#> `stat_bin()` using `bins = 30`. Pick better value with `binwidth`.
 ## Plot Types
# Change default plot behavior
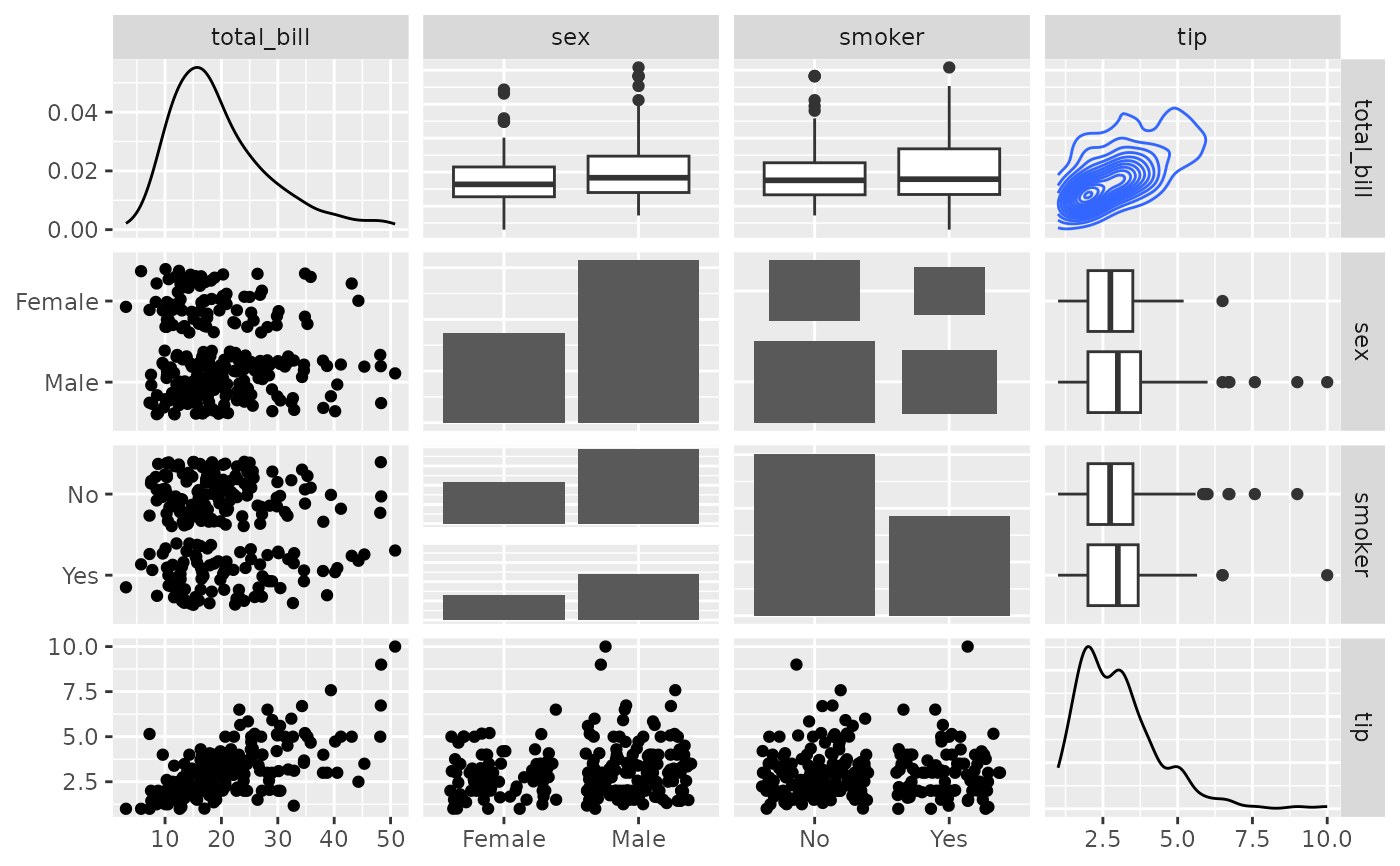
pm <- ggpairs(
tips[, c(1, 3, 4, 2)],
upper = list(continuous = "density", combo = "box_no_facet"),
lower = list(continuous = "points", combo = "dot_no_facet")
)
p_(pm)
## Plot Types
# Change default plot behavior
pm <- ggpairs(
tips[, c(1, 3, 4, 2)],
upper = list(continuous = "density", combo = "box_no_facet"),
lower = list(continuous = "points", combo = "dot_no_facet")
)
p_(pm)
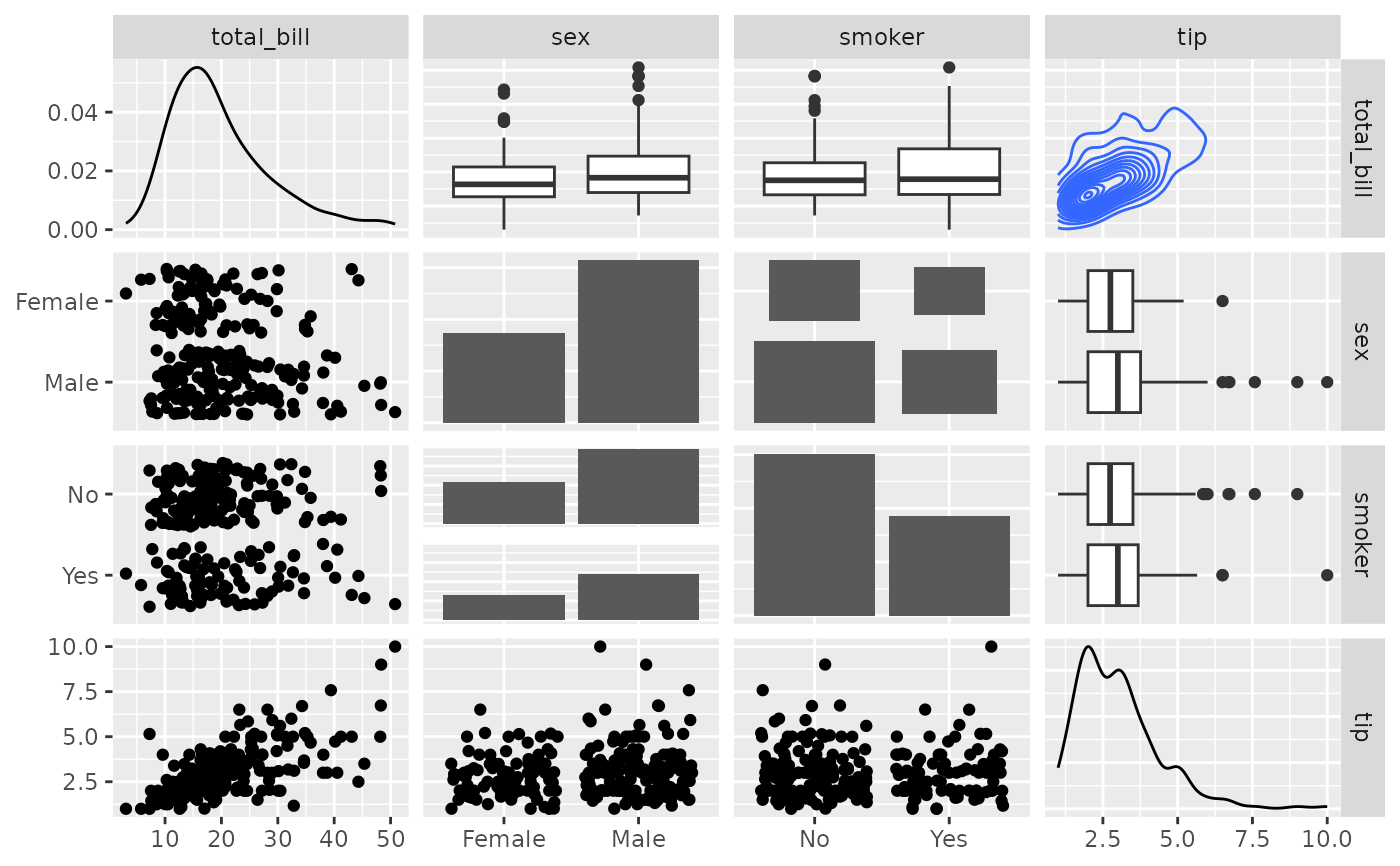
 # Supply Raw Functions (may be user defined functions!)
pm <- ggpairs(
tips[, c(1, 3, 4, 2)],
upper = list(continuous = ggally_density, combo = ggally_box_no_facet),
lower = list(continuous = ggally_points, combo = ggally_dot_no_facet)
)
p_(pm)
# Supply Raw Functions (may be user defined functions!)
pm <- ggpairs(
tips[, c(1, 3, 4, 2)],
upper = list(continuous = ggally_density, combo = ggally_box_no_facet),
lower = list(continuous = ggally_points, combo = ggally_dot_no_facet)
)
p_(pm)
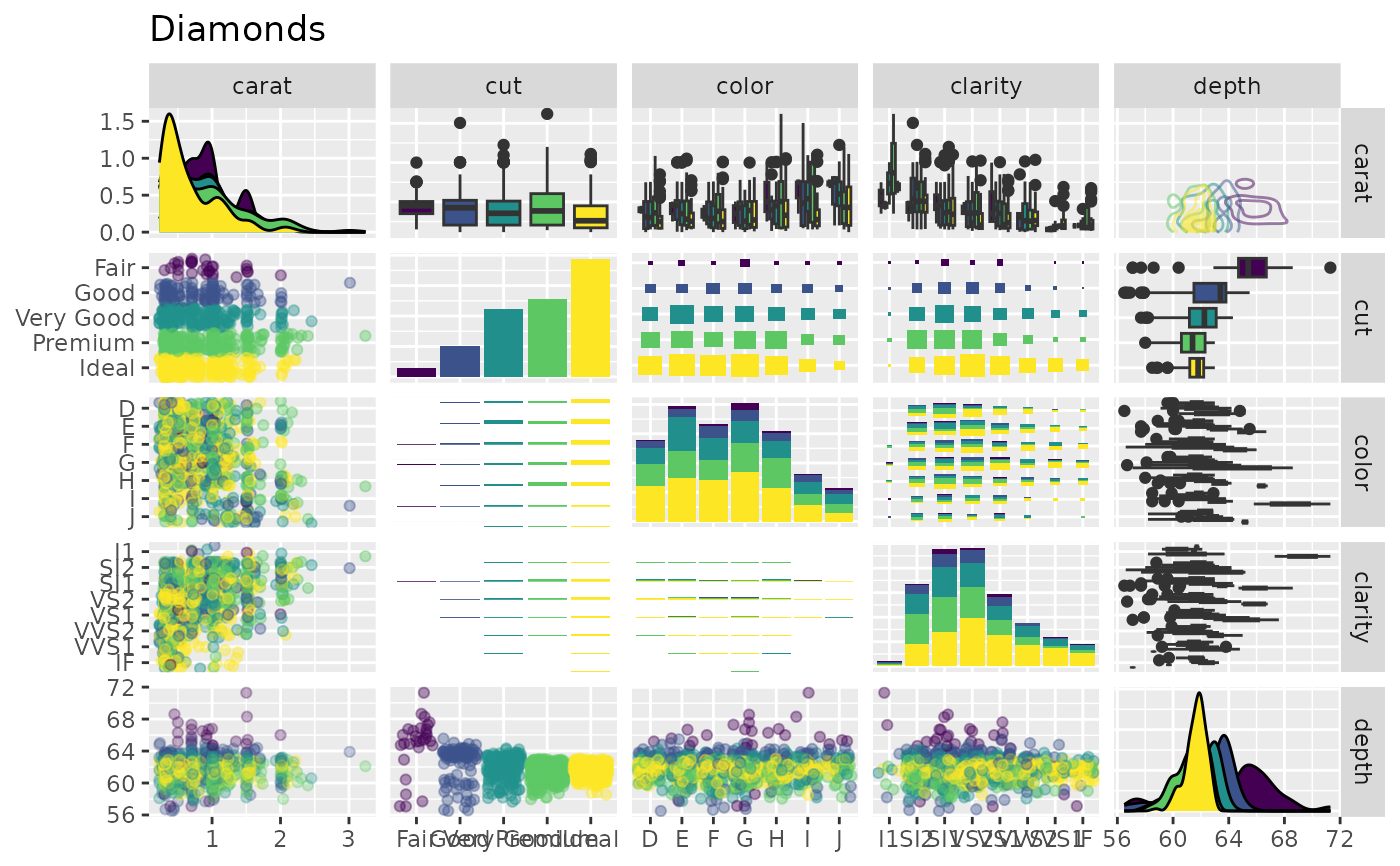
 # Use sample of the diamonds data
data(diamonds, package = "ggplot2")
diamonds.samp <- diamonds[sample(1:dim(diamonds)[1], 1000), ]
# Different aesthetics for different plot sections and plot types
pm <- ggpairs(
diamonds.samp[, 1:5],
mapping = ggplot2::aes(color = cut),
upper = list(continuous = wrap("density", alpha = 0.5), combo = "box_no_facet"),
lower = list(continuous = wrap("points", alpha = 0.3), combo = wrap("dot_no_facet", alpha = 0.4)),
title = "Diamonds"
)
p_(pm)
# Use sample of the diamonds data
data(diamonds, package = "ggplot2")
diamonds.samp <- diamonds[sample(1:dim(diamonds)[1], 1000), ]
# Different aesthetics for different plot sections and plot types
pm <- ggpairs(
diamonds.samp[, 1:5],
mapping = ggplot2::aes(color = cut),
upper = list(continuous = wrap("density", alpha = 0.5), combo = "box_no_facet"),
lower = list(continuous = wrap("points", alpha = 0.3), combo = wrap("dot_no_facet", alpha = 0.4)),
title = "Diamonds"
)
p_(pm)
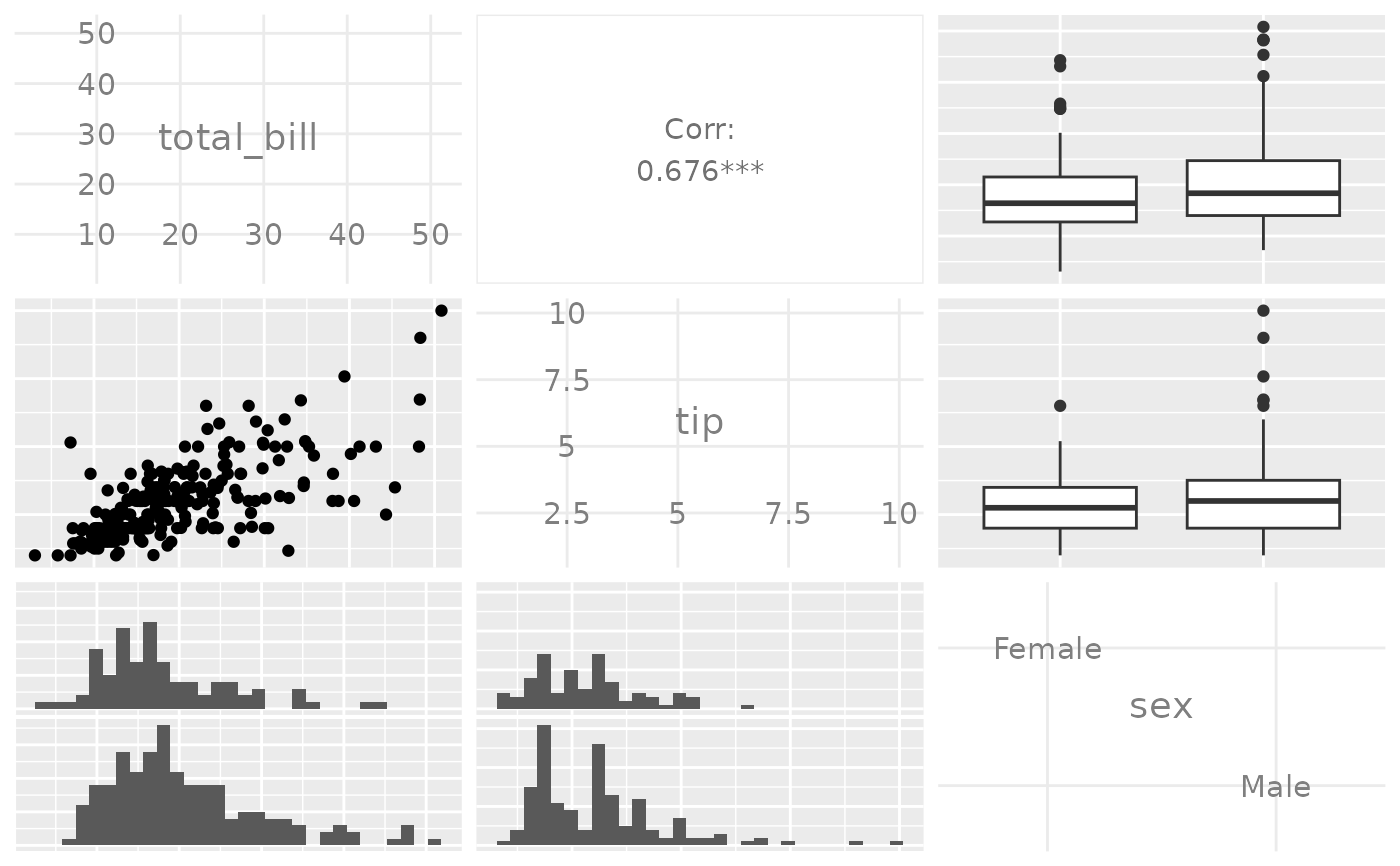
 ## Axis Label Variations
# Only Variable Labels on the diagonal (no axis labels)
pm <- ggpairs(tips[, 1:3], axisLabels = "internal")
p_(pm)
#> `stat_bin()` using `bins = 30`. Pick better value with `binwidth`.
#> `stat_bin()` using `bins = 30`. Pick better value with `binwidth`.
## Axis Label Variations
# Only Variable Labels on the diagonal (no axis labels)
pm <- ggpairs(tips[, 1:3], axisLabels = "internal")
p_(pm)
#> `stat_bin()` using `bins = 30`. Pick better value with `binwidth`.
#> `stat_bin()` using `bins = 30`. Pick better value with `binwidth`.
 # Only Variable Labels on the outside (no axis labels)
pm <- ggpairs(tips[, 1:3], axisLabels = "none")
p_(pm)
#> `stat_bin()` using `bins = 30`. Pick better value with `binwidth`.
#> `stat_bin()` using `bins = 30`. Pick better value with `binwidth`.
# Only Variable Labels on the outside (no axis labels)
pm <- ggpairs(tips[, 1:3], axisLabels = "none")
p_(pm)
#> `stat_bin()` using `bins = 30`. Pick better value with `binwidth`.
#> `stat_bin()` using `bins = 30`. Pick better value with `binwidth`.
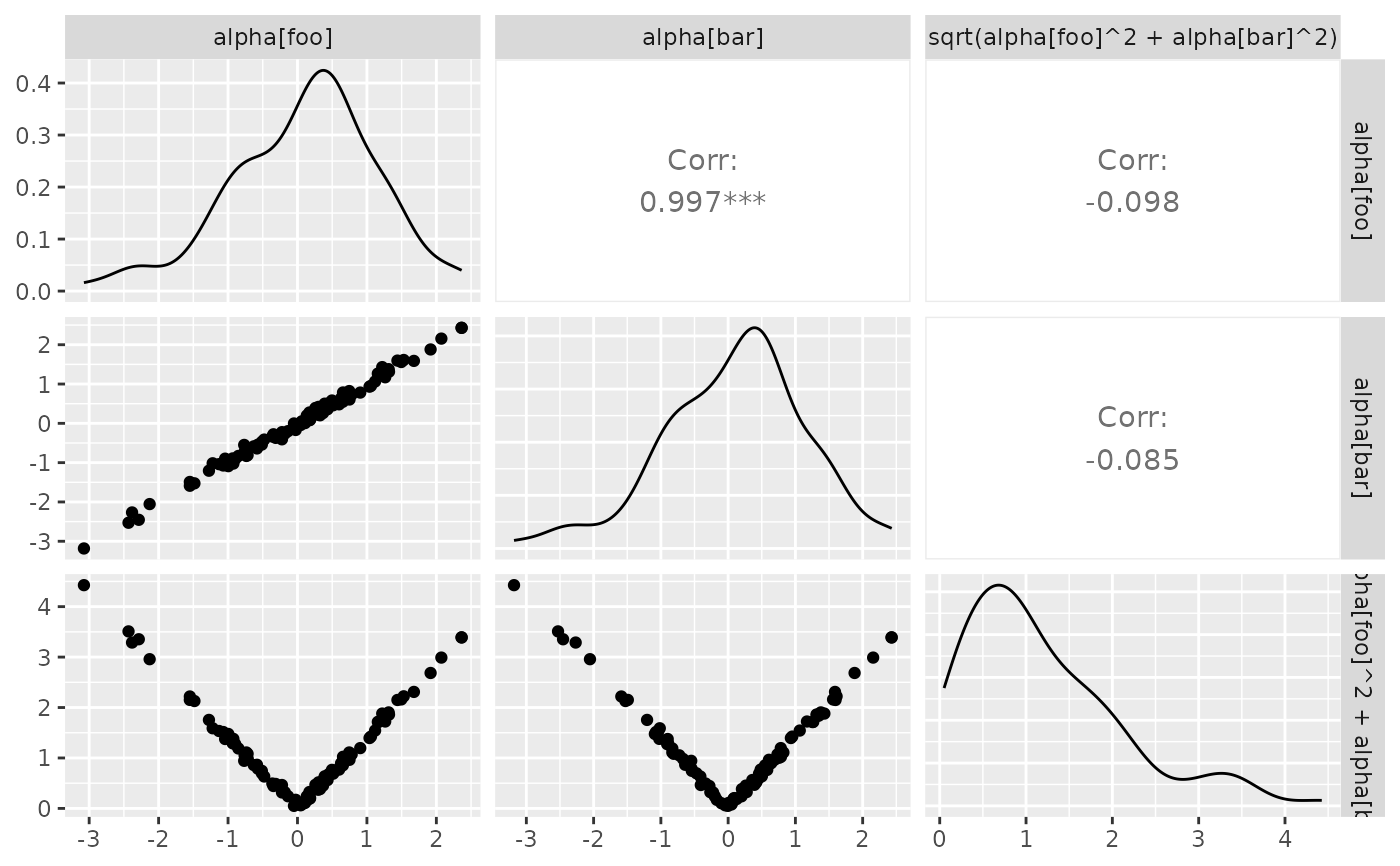
 ## Facet Label Variations
# Default:
df_x <- rnorm(100)
df_y <- df_x + rnorm(100, 0, 0.1)
df <- data.frame(x = df_x, y = df_y, c = sqrt(df_x^2 + df_y^2))
pm <- ggpairs(
df,
columnLabels = c("alpha[foo]", "alpha[bar]", "sqrt(alpha[foo]^2 + alpha[bar]^2)")
)
p_(pm)
## Facet Label Variations
# Default:
df_x <- rnorm(100)
df_y <- df_x + rnorm(100, 0, 0.1)
df <- data.frame(x = df_x, y = df_y, c = sqrt(df_x^2 + df_y^2))
pm <- ggpairs(
df,
columnLabels = c("alpha[foo]", "alpha[bar]", "sqrt(alpha[foo]^2 + alpha[bar]^2)")
)
p_(pm)
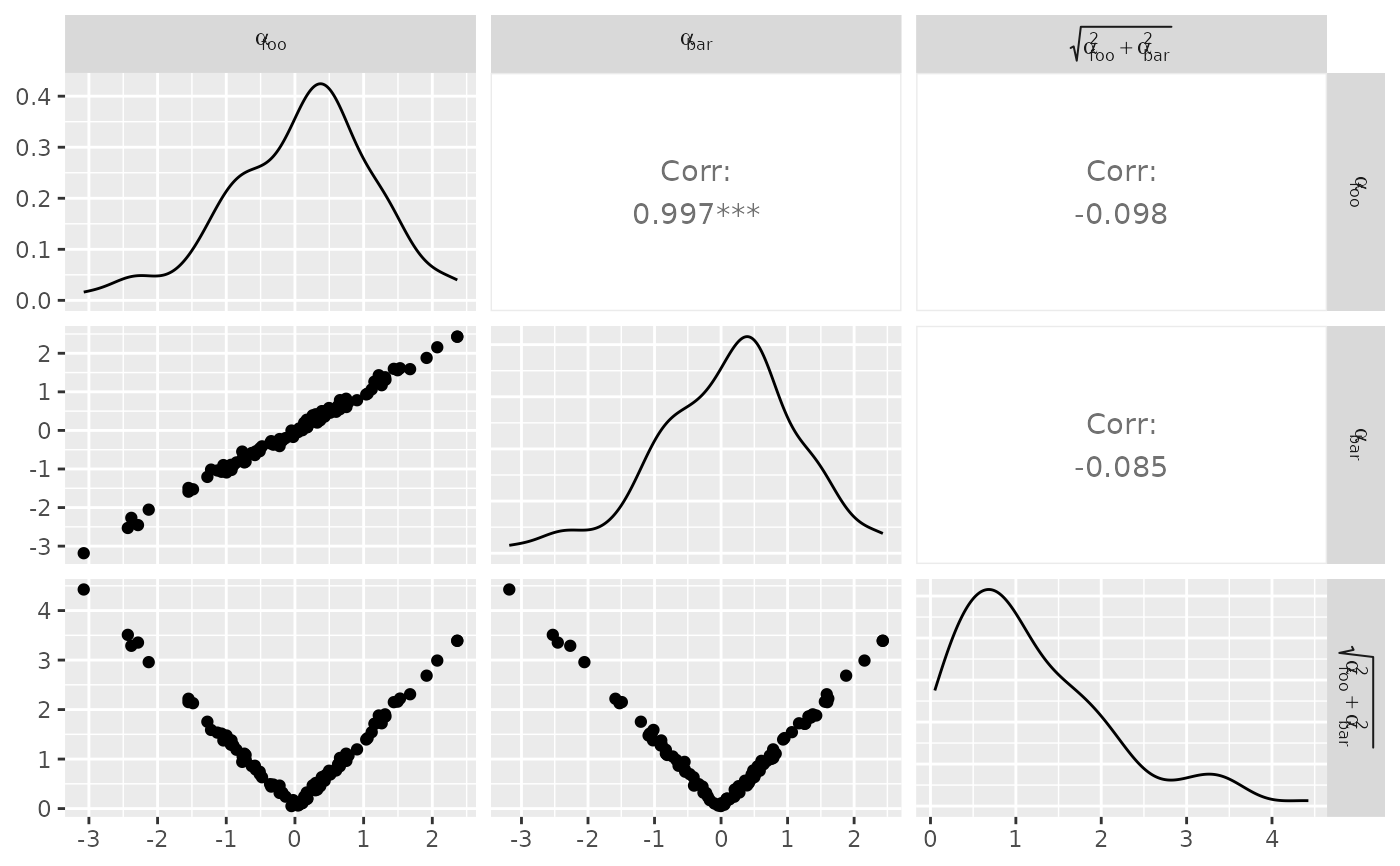
 # Parsed labels:
pm <- ggpairs(
df,
columnLabels = c("alpha[foo]", "alpha[bar]", "sqrt(alpha[foo]^2 + alpha[bar]^2)"),
labeller = "label_parsed"
)
p_(pm)
# Parsed labels:
pm <- ggpairs(
df,
columnLabels = c("alpha[foo]", "alpha[bar]", "sqrt(alpha[foo]^2 + alpha[bar]^2)"),
labeller = "label_parsed"
)
p_(pm)
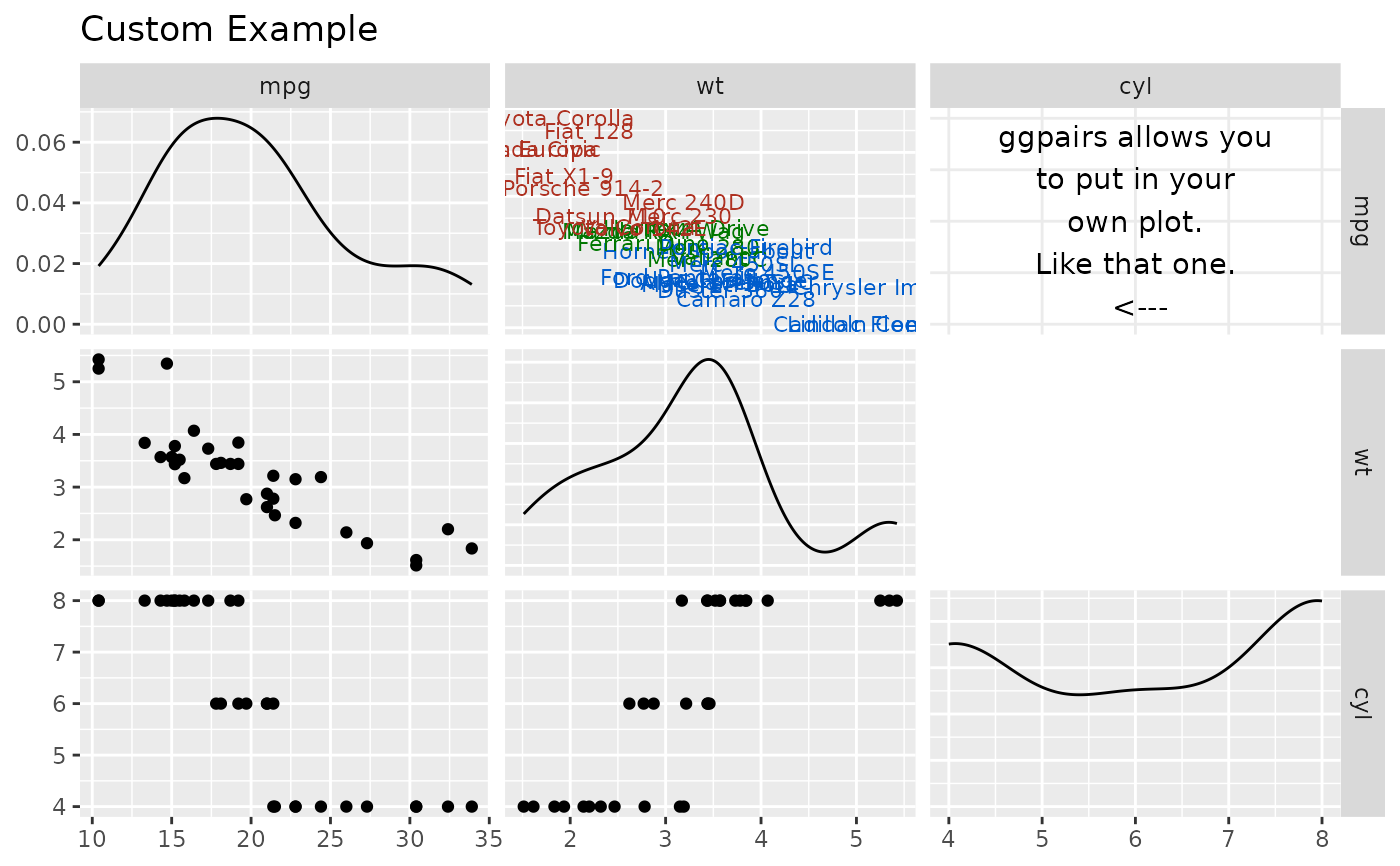
 ## Plot Insertion Example
custom_car <- ggpairs(mtcars[, c("mpg", "wt", "cyl")], upper = "blank", title = "Custom Example")
# ggplot example taken from example(geom_text)
plot <- ggplot2::ggplot(mtcars, ggplot2::aes(x = wt, y = mpg, label = rownames(mtcars)))
plot <- plot +
ggplot2::geom_text(ggplot2::aes(colour = factor(cyl)), size = 3) +
ggplot2::scale_colour_discrete(l = 40)
custom_car[1, 2] <- plot
personal_plot <- ggally_text(
"ggpairs allows you\nto put in your\nown plot.\nLike that one.\n <---"
)
custom_car[1, 3] <- personal_plot
p_(custom_car)
## Plot Insertion Example
custom_car <- ggpairs(mtcars[, c("mpg", "wt", "cyl")], upper = "blank", title = "Custom Example")
# ggplot example taken from example(geom_text)
plot <- ggplot2::ggplot(mtcars, ggplot2::aes(x = wt, y = mpg, label = rownames(mtcars)))
plot <- plot +
ggplot2::geom_text(ggplot2::aes(colour = factor(cyl)), size = 3) +
ggplot2::scale_colour_discrete(l = 40)
custom_car[1, 2] <- plot
personal_plot <- ggally_text(
"ggpairs allows you\nto put in your\nown plot.\nLike that one.\n <---"
)
custom_car[1, 3] <- personal_plot
p_(custom_car)
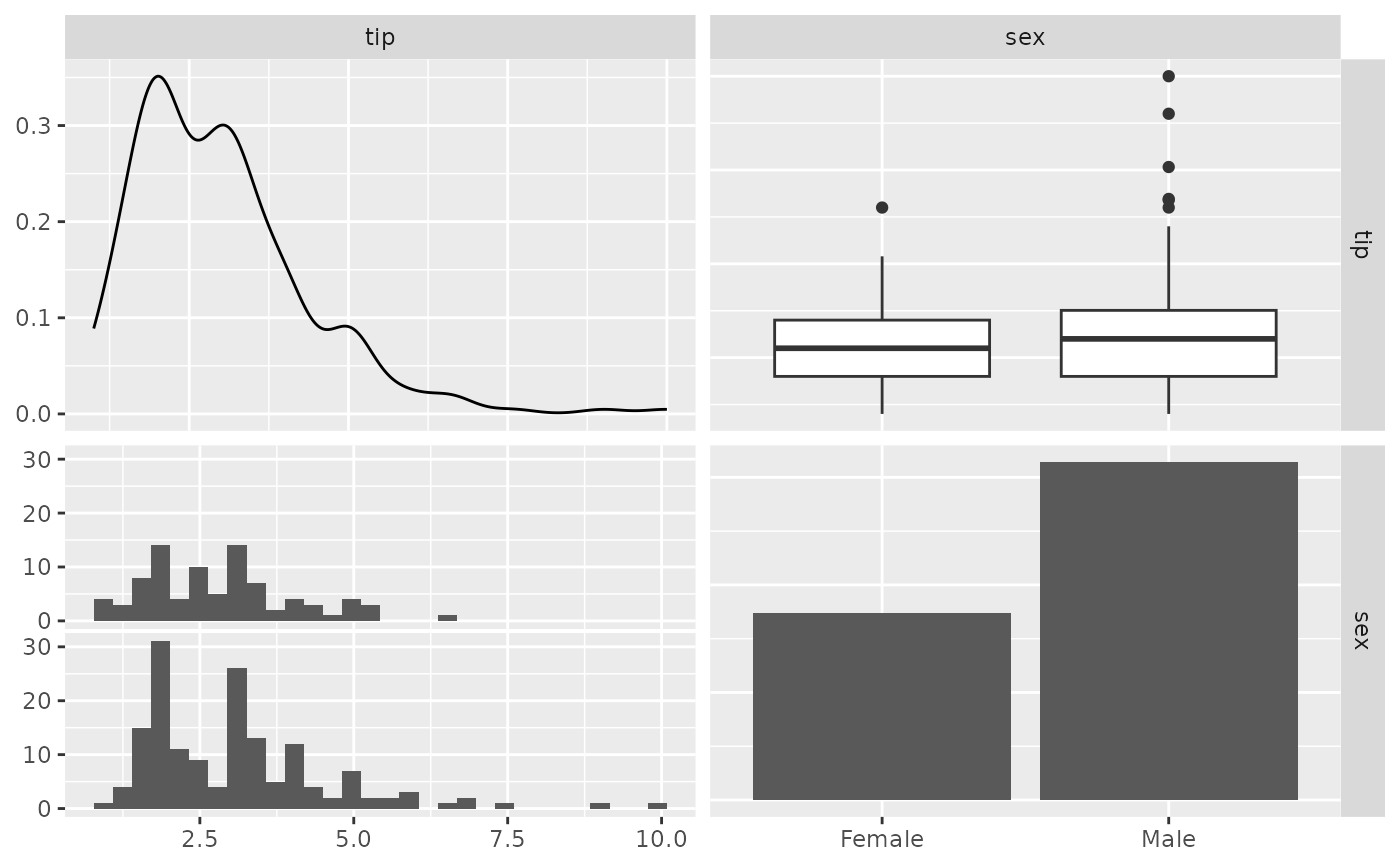
 ## Remove binwidth warning from ggplot2
# displays warning about picking a better binwidth
pm <- ggpairs(tips, 2:3)
p_(pm)
#> `stat_bin()` using `bins = 30`. Pick better value with `binwidth`.
## Remove binwidth warning from ggplot2
# displays warning about picking a better binwidth
pm <- ggpairs(tips, 2:3)
p_(pm)
#> `stat_bin()` using `bins = 30`. Pick better value with `binwidth`.
 # no warning displayed
pm <- ggpairs(tips, 2:3, lower = list(combo = wrap("facethist", binwidth = 0.5)))
p_(pm)
# no warning displayed
pm <- ggpairs(tips, 2:3, lower = list(combo = wrap("facethist", binwidth = 0.5)))
p_(pm)
 # no warning displayed with user supplied function
pm <- ggpairs(tips, 2:3, lower = list(combo = wrap(ggally_facethist, binwidth = 0.5)))
p_(pm)
# no warning displayed with user supplied function
pm <- ggpairs(tips, 2:3, lower = list(combo = wrap(ggally_facethist, binwidth = 0.5)))
p_(pm)
 ## Remove panel grid lines from correlation plots
pm <- ggpairs(
flea,
columns = 2:4,
upper = list(continuous = wrap(ggally_cor, displayGrid = FALSE))
)
p_(pm)
## Remove panel grid lines from correlation plots
pm <- ggpairs(
flea,
columns = 2:4,
upper = list(continuous = wrap(ggally_cor, displayGrid = FALSE))
)
p_(pm)
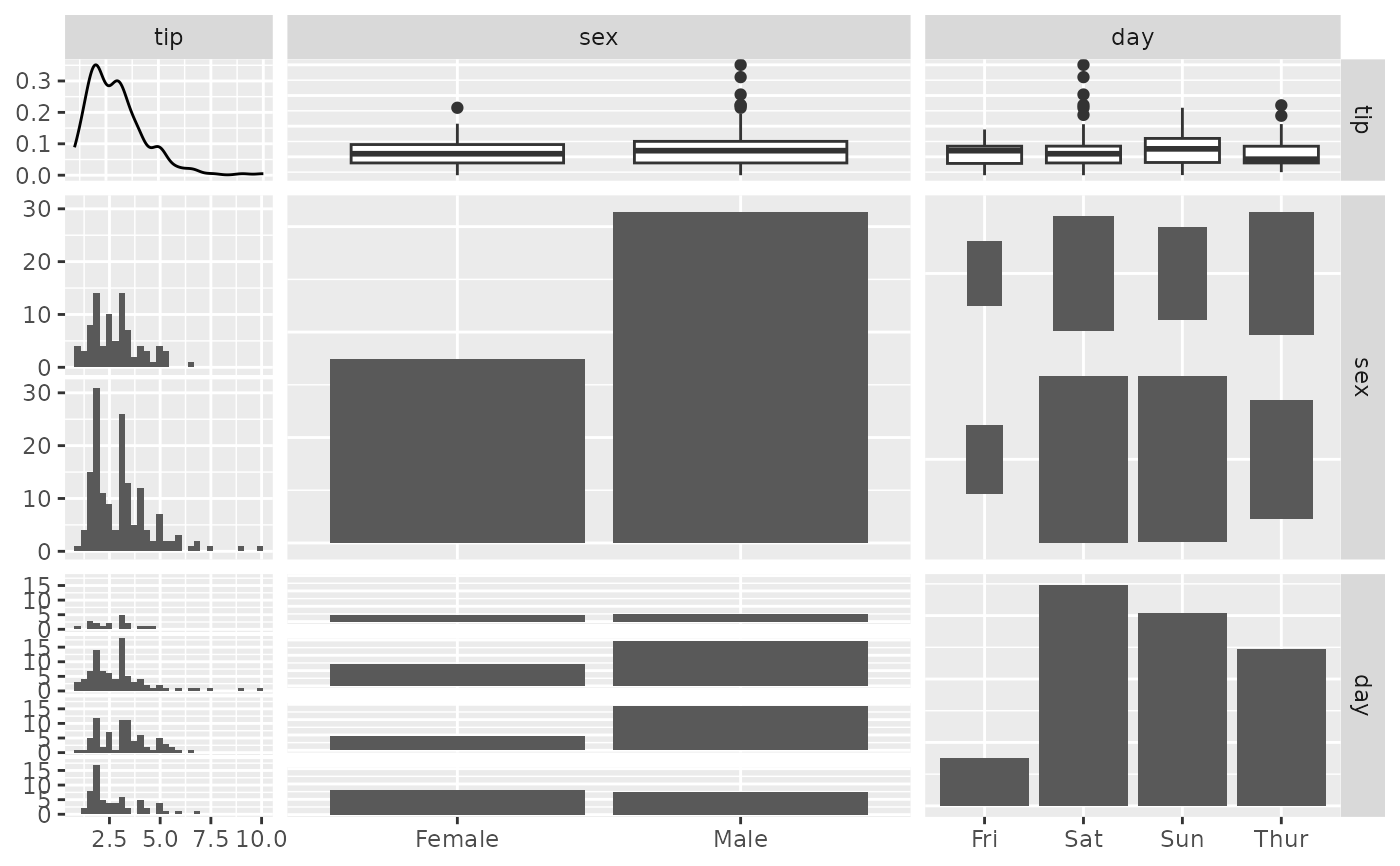
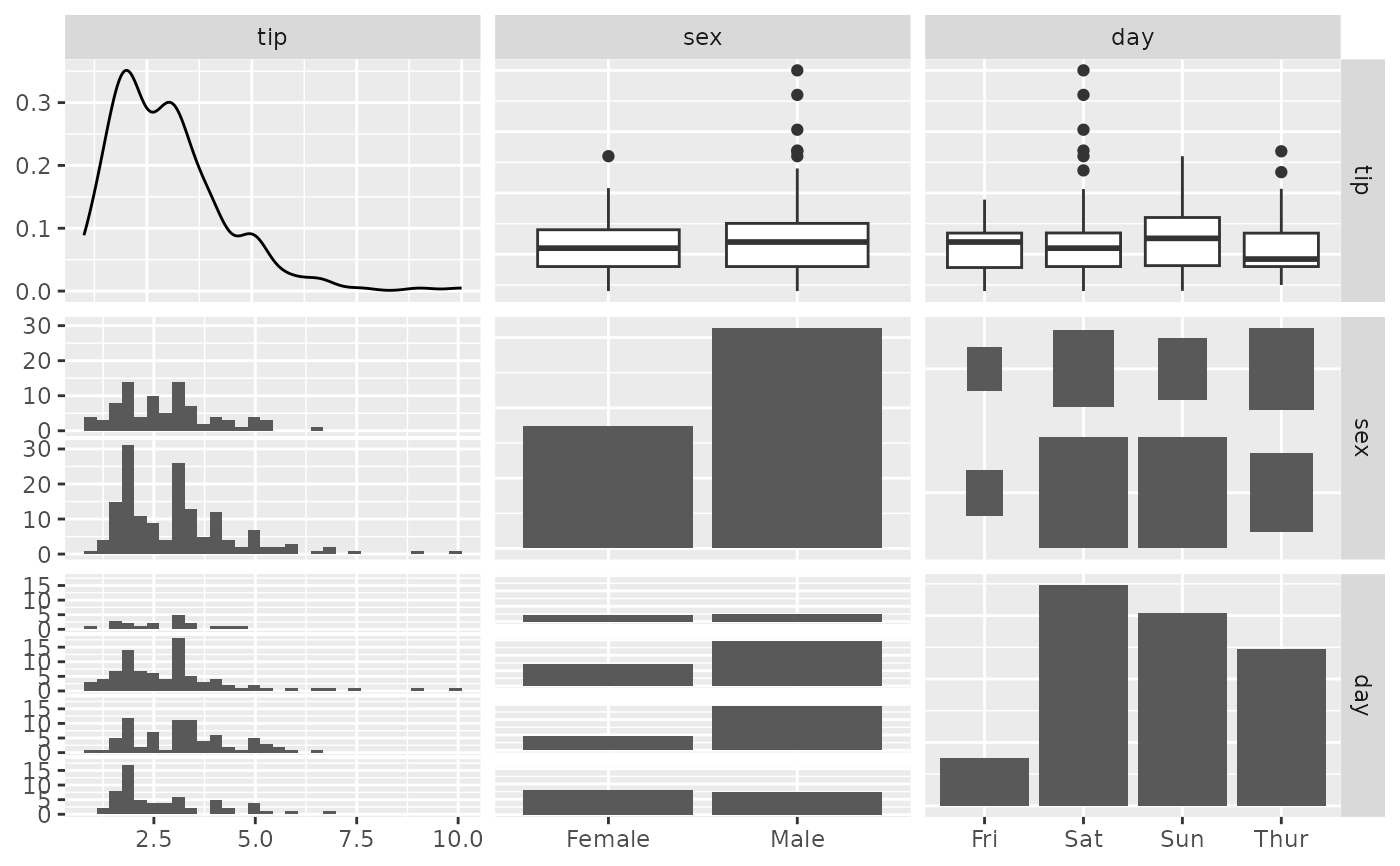
 ## Custom with/height of subplots
pm <- ggpairs(tips, columns = c(2, 3, 5))
p_(pm)
#> `stat_bin()` using `bins = 30`. Pick better value with `binwidth`.
#> `stat_bin()` using `bins = 30`. Pick better value with `binwidth`.
## Custom with/height of subplots
pm <- ggpairs(tips, columns = c(2, 3, 5))
p_(pm)
#> `stat_bin()` using `bins = 30`. Pick better value with `binwidth`.
#> `stat_bin()` using `bins = 30`. Pick better value with `binwidth`.
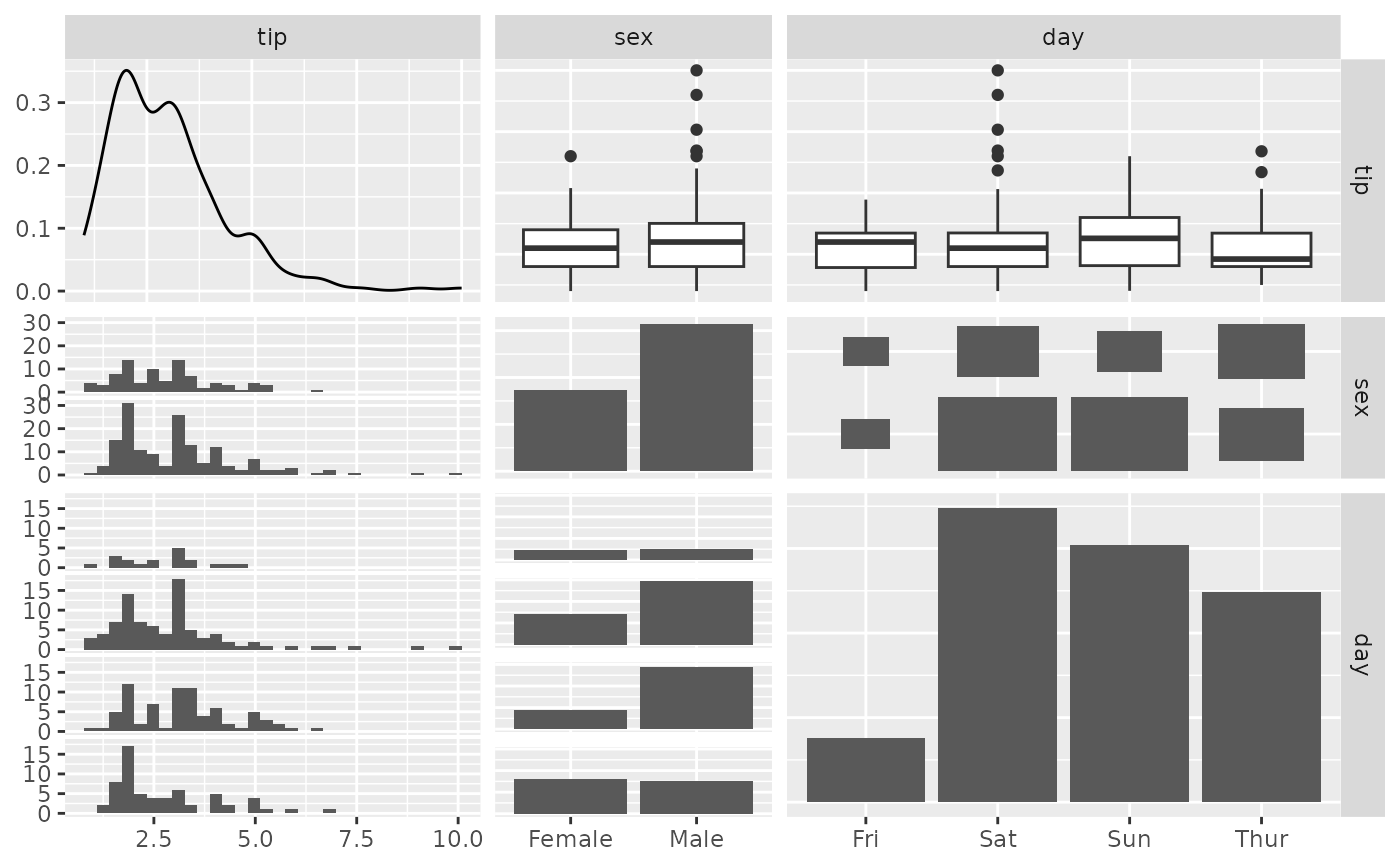
 pm <- ggpairs(tips, columns = c(2, 3, 5), proportions = "auto")
p_(pm)
#> `stat_bin()` using `bins = 30`. Pick better value with `binwidth`.
#> `stat_bin()` using `bins = 30`. Pick better value with `binwidth`.
pm <- ggpairs(tips, columns = c(2, 3, 5), proportions = "auto")
p_(pm)
#> `stat_bin()` using `bins = 30`. Pick better value with `binwidth`.
#> `stat_bin()` using `bins = 30`. Pick better value with `binwidth`.
 pm <- ggpairs(tips, columns = c(2, 3, 5), proportions = c(1, 3, 2))
p_(pm)
#> `stat_bin()` using `bins = 30`. Pick better value with `binwidth`.
#> `stat_bin()` using `bins = 30`. Pick better value with `binwidth`.
pm <- ggpairs(tips, columns = c(2, 3, 5), proportions = c(1, 3, 2))
p_(pm)
#> `stat_bin()` using `bins = 30`. Pick better value with `binwidth`.
#> `stat_bin()` using `bins = 30`. Pick better value with `binwidth`.