Estimate correlation from the given data. If a color variable is supplied, the correlation will also be calculated per group.
Usage
ggally_cor(
  data,
  mapping,
  ...,
  stars = TRUE,
  method = "pearson",
  display_grid = FALSE,
  digits = 3,
  title_args = list(...),
  group_args = list(...),
  justify_labels = "right",
  align_percent = 0.5,
  title = "Corr",
  na.rm = NA,
  use = deprecated(),
  alignPercent = deprecated(),
  displayGrid = deprecated()
)
Arguments
- data
data set using
- mapping
aesthetics being used
- ...
other arguments being supplied to
geom_text()for the title and groups- stars
logical value which determines if the significance stars should be displayed. Given the
cor.testp-values, display"***"if the p-value is
< 0.001"**"if the p-value is
< 0.01"*"if the p-value is
< 0.05"."if the p-value is
< 0.10""otherwise
- method
methodsupplied to cor function- display_grid
if
TRUE, display aligned panel grid lines. IfFALSE(default), display a thin panel border.- digits
number of digits to be displayed after the decimal point. See
formatCfor how numbers are calculated.- title_args
arguments being supplied to the title's
geom_text()- group_args
arguments being supplied to the split-by-color group's
geom_text()- justify_labels
justifyargument supplied whenformatting the labels- align_percent
relative align position of the text. When
justify_labels = 0.5, this should not be needed to be set.- title
title text to be displayed
- na.rm
logical value which determines if
NAvalues are removed. IfTRUE, no warning message will be displayed.- use
![[Deprecated]](figures/lifecycle-deprecated.svg) . This variable is not used internally. Please remove it from your code.
. This variable is not used internally. Please remove it from your code.- alignPercent, displayGrid
- . Please use their snake-case counterparts.
Examples
# Small function to display plots only if it's interactive
p_ <- GGally::print_if_interactive
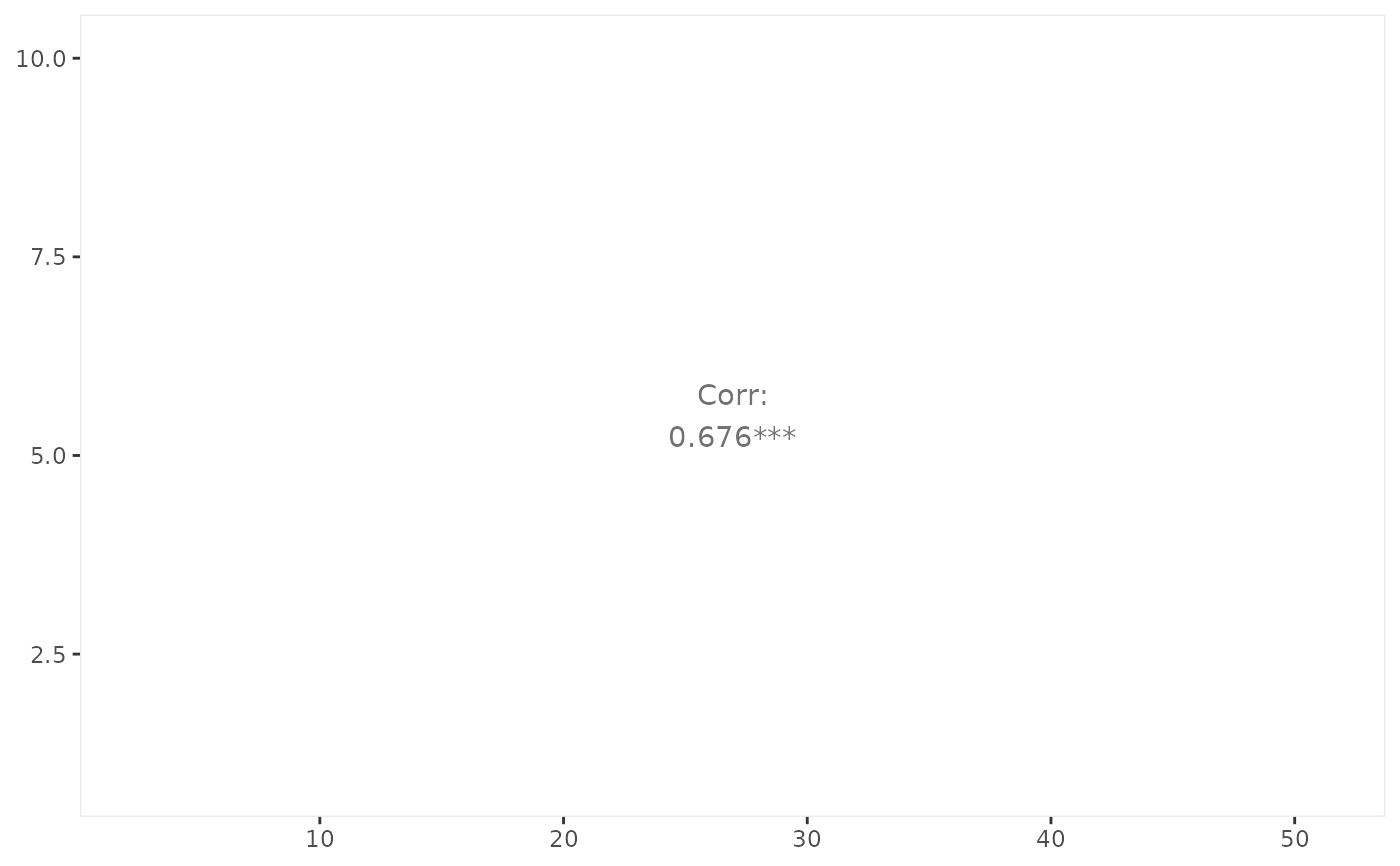
data(tips)
p_(ggally_cor(tips, mapping = ggplot2::aes(total_bill, tip)))
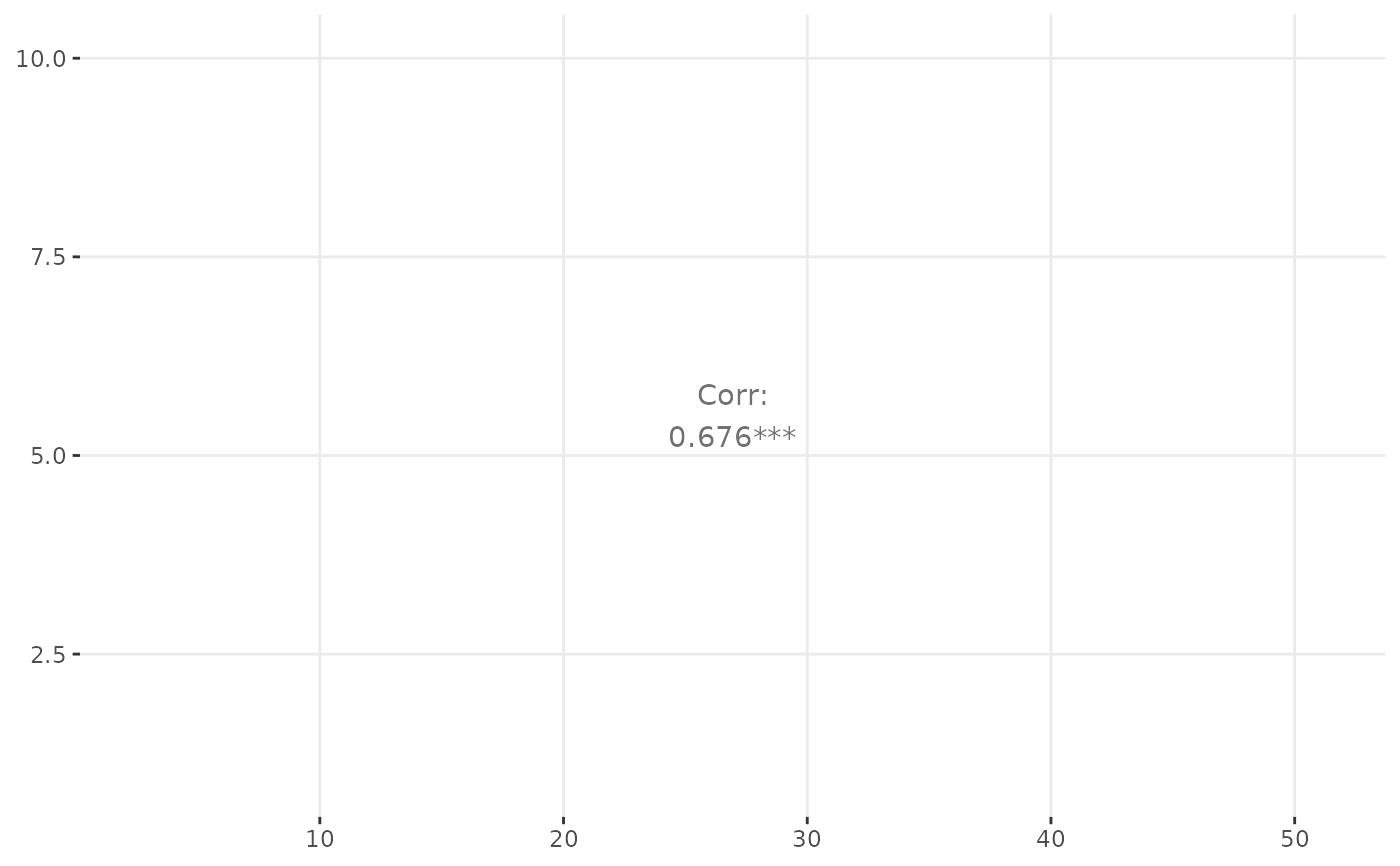
 # display with grid
p_(ggally_cor(
tips,
mapping = ggplot2::aes(total_bill, tip),
display_grid = TRUE
))
# display with grid
p_(ggally_cor(
tips,
mapping = ggplot2::aes(total_bill, tip),
display_grid = TRUE
))
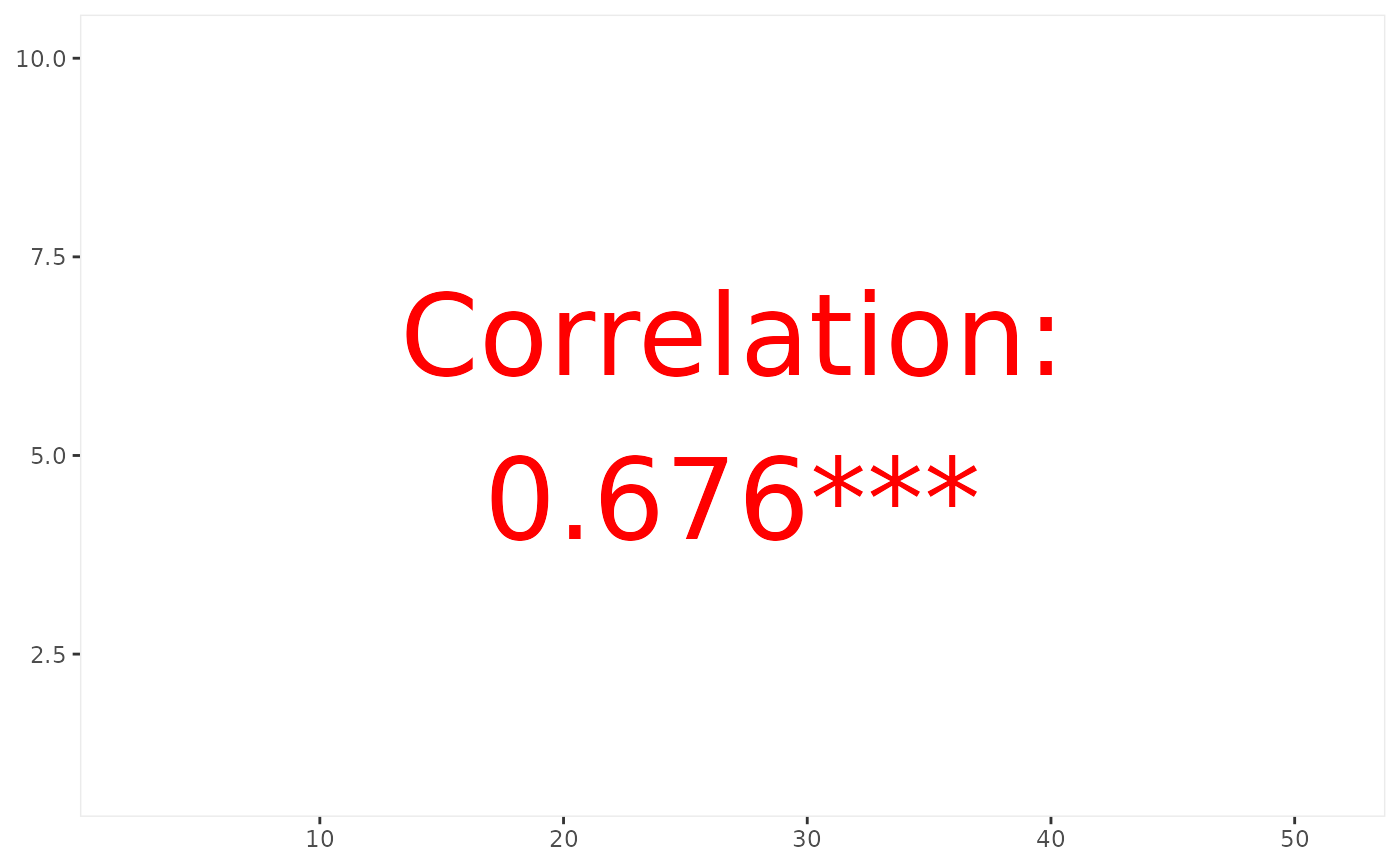
 # change text attributes
p_(ggally_cor(
tips,
mapping = ggplot2::aes(x = total_bill, y = tip),
size = 15,
colour = I("red"),
title = "Correlation"
))
# change text attributes
p_(ggally_cor(
tips,
mapping = ggplot2::aes(x = total_bill, y = tip),
size = 15,
colour = I("red"),
title = "Correlation"
))
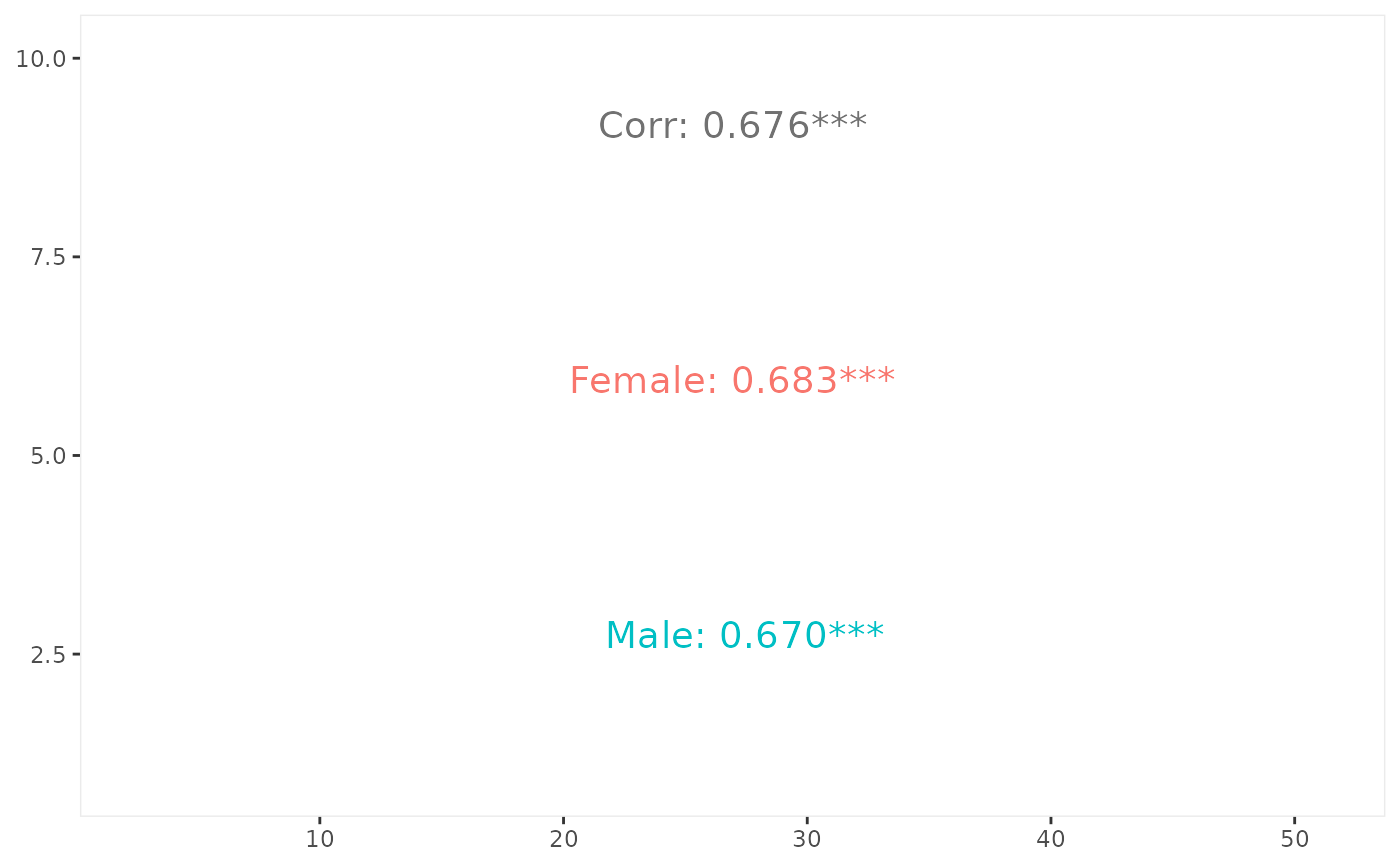
 # split by a variable
p_(ggally_cor(
tips,
mapping = ggplot2::aes(total_bill, tip, color = sex),
size = 5
))
# split by a variable
p_(ggally_cor(
tips,
mapping = ggplot2::aes(total_bill, tip, color = sex),
size = 5
))