![[Deprecated]](figures/lifecycle-deprecated.svg)
Estimate correlation from the given data.
This function is deprecated and will be removed in future releases.
See ggally_cor.
Usage
ggally_cor_v1_5(
  data,
  mapping,
  alignPercent = 0.6,
  method = "pearson",
  use = "complete.obs",
  corAlignPercent = NULL,
  corMethod = NULL,
  corUse = NULL,
  displayGrid = TRUE,
  ...
)
Arguments
- data
data set using
- mapping
aesthetics being used
- alignPercent
right align position of numbers. Default is 60 percent across the horizontal
- method
methodsupplied to cor function- use
usesupplied to cor function- corAlignPercent
deprecated. Use parameter
alignPercent- corMethod
deprecated. Use parameter
method- corUse
deprecated. Use parameter
use- displayGrid
if TRUE, display aligned panel gridlines
- ...
other arguments being supplied to geom_text
Examples
# Small function to display plots only if it's interactive
p_ <- GGally::print_if_interactive
data(tips)
p_(ggally_cor_v1_5(tips, mapping = ggplot2::aes(total_bill, tip)))
#> Warning: `ggally_cor_v1_5()` was deprecated in GGally 2.3.0.
#> ℹ Please use `ggally_cor()` instead.
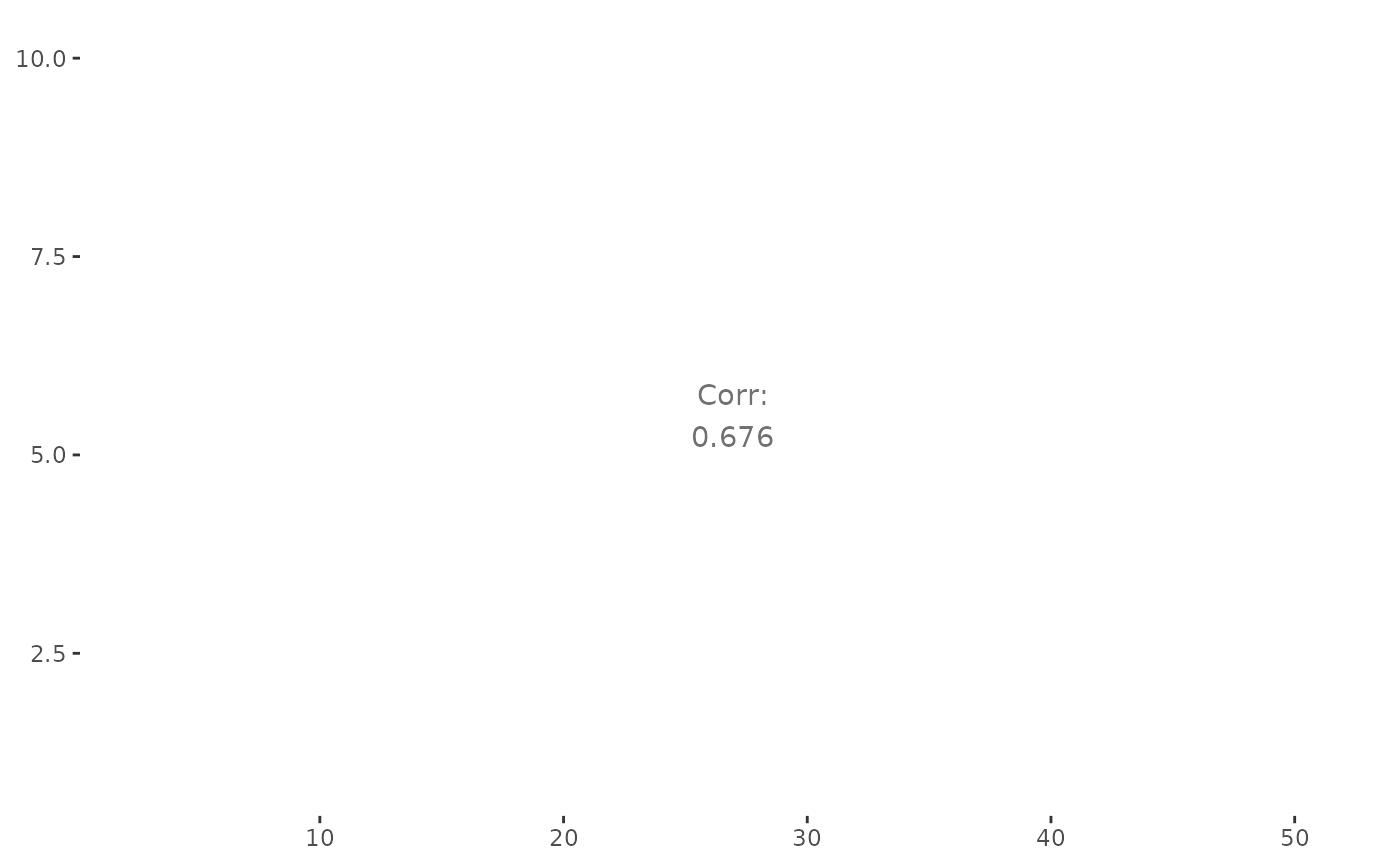
 # display with no grid
p_(ggally_cor_v1_5(
tips,
mapping = ggplot2::aes(total_bill, tip),
displayGrid = FALSE
))
# display with no grid
p_(ggally_cor_v1_5(
tips,
mapping = ggplot2::aes(total_bill, tip),
displayGrid = FALSE
))
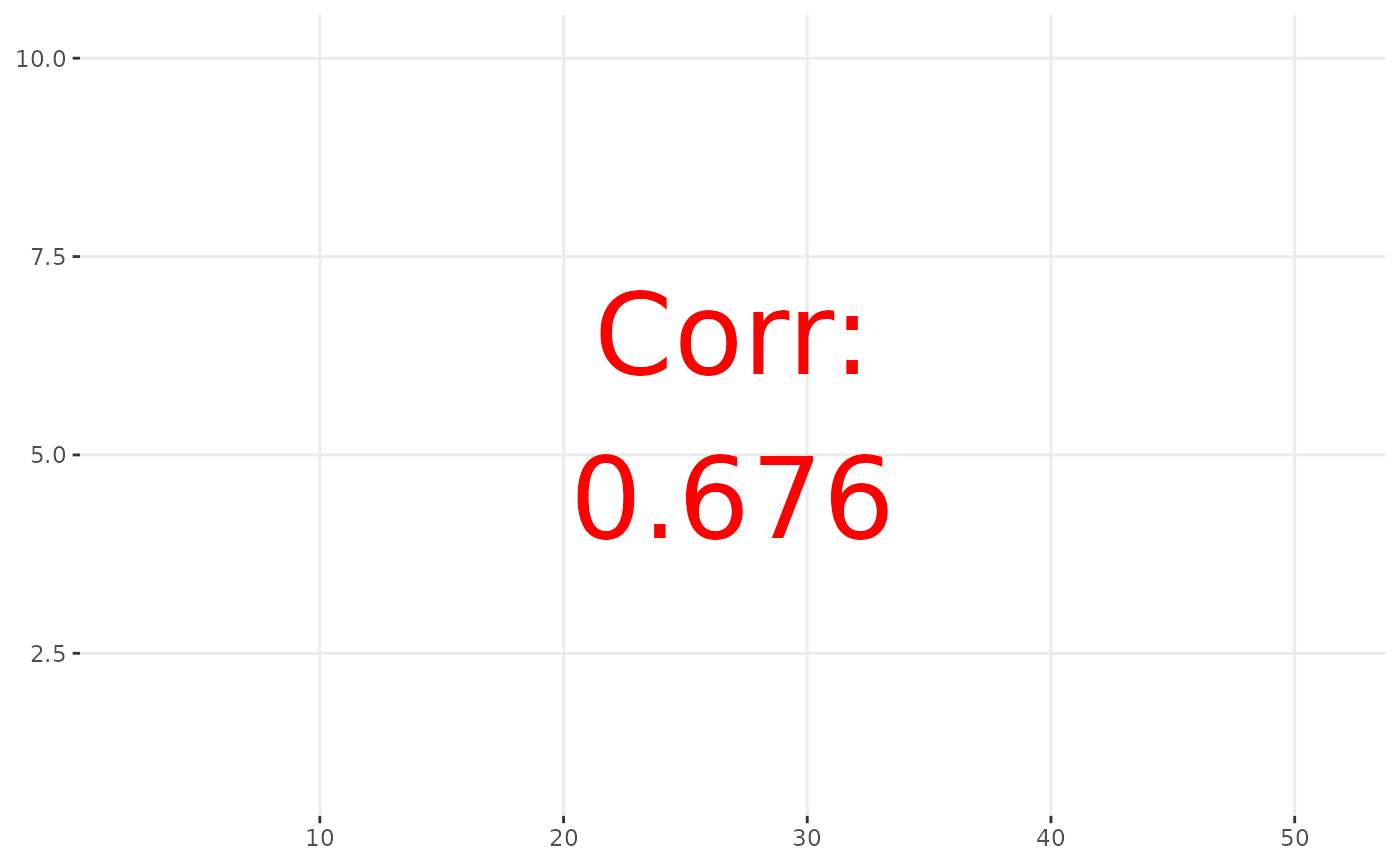
 # change text attributes
p_(ggally_cor_v1_5(
tips,
mapping = ggplot2::aes(x = total_bill, y = tip),
size = 15,
colour = I("red")
))
# change text attributes
p_(ggally_cor_v1_5(
tips,
mapping = ggplot2::aes(x = total_bill, y = tip),
size = 15,
colour = I("red")
))
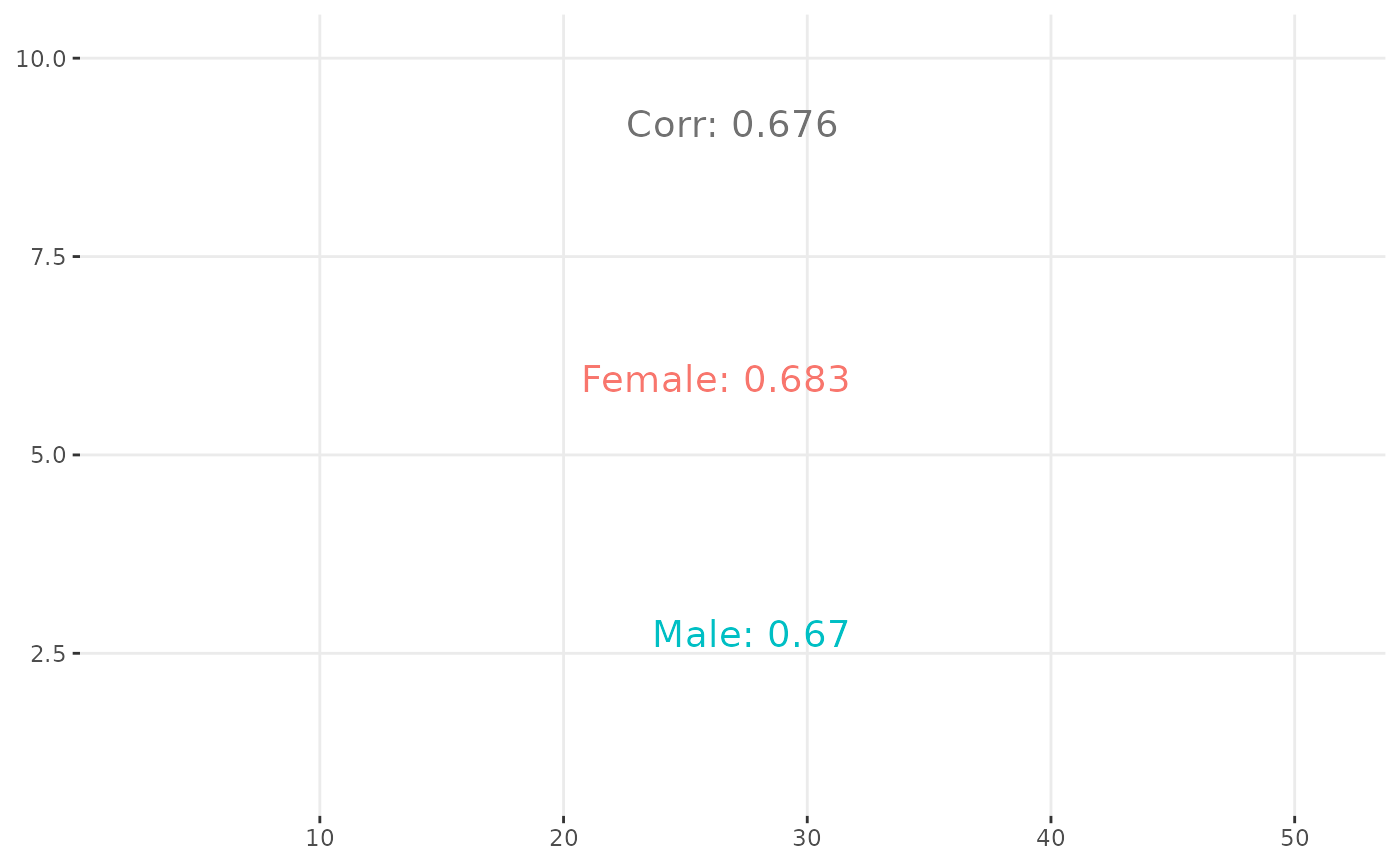
 # split by a variable
p_(ggally_cor_v1_5(
tips,
mapping = ggplot2::aes(total_bill, tip, color = sex),
size = 5
))
# split by a variable
p_(ggally_cor_v1_5(
tips,
mapping = ggplot2::aes(total_bill, tip, color = sex),
size = 5
))