Single ggplot2 plot matrix with facet_grid
Arguments
- data
data.frame that contains all columns to be displayed. This data will be melted before being passed into the function
fn- mapping
aesthetic mapping (besides
xandy). Seeaes()- columnsX
columns to be displayed in the plot matrix
- columnsY
rows to be displayed in the plot matrix
- fn
function to be executed. Similar to
ggpairsandggduo, the function may either be a string identifier or a real function thatwrapunderstands.- ...
extra arguments passed directly to
fn- columnLabelsX, columnLabelsY
column and row labels to display in the plot matrix
- xlab, ylab, title
plot matrix labels
- scales
parameter supplied to
ggplot2::facet_grid. Default behavior is"free"
Examples
# Small function to display plots only if it's interactive
p_ <- GGally::print_if_interactive
if (requireNamespace("chemometrics", quietly = TRUE)) {
data(NIR, package = "chemometrics")
NIR_sub <- data.frame(NIR$yGlcEtOH, NIR$xNIR[, 1:3])
str(NIR_sub)
x_cols <- c("X1115.0", "X1120.0", "X1125.0")
y_cols <- c("Glucose", "Ethanol")
# using ggduo directly
p <- ggduo(NIR_sub, x_cols, y_cols, types = list(continuous = "points"))
p_(p)
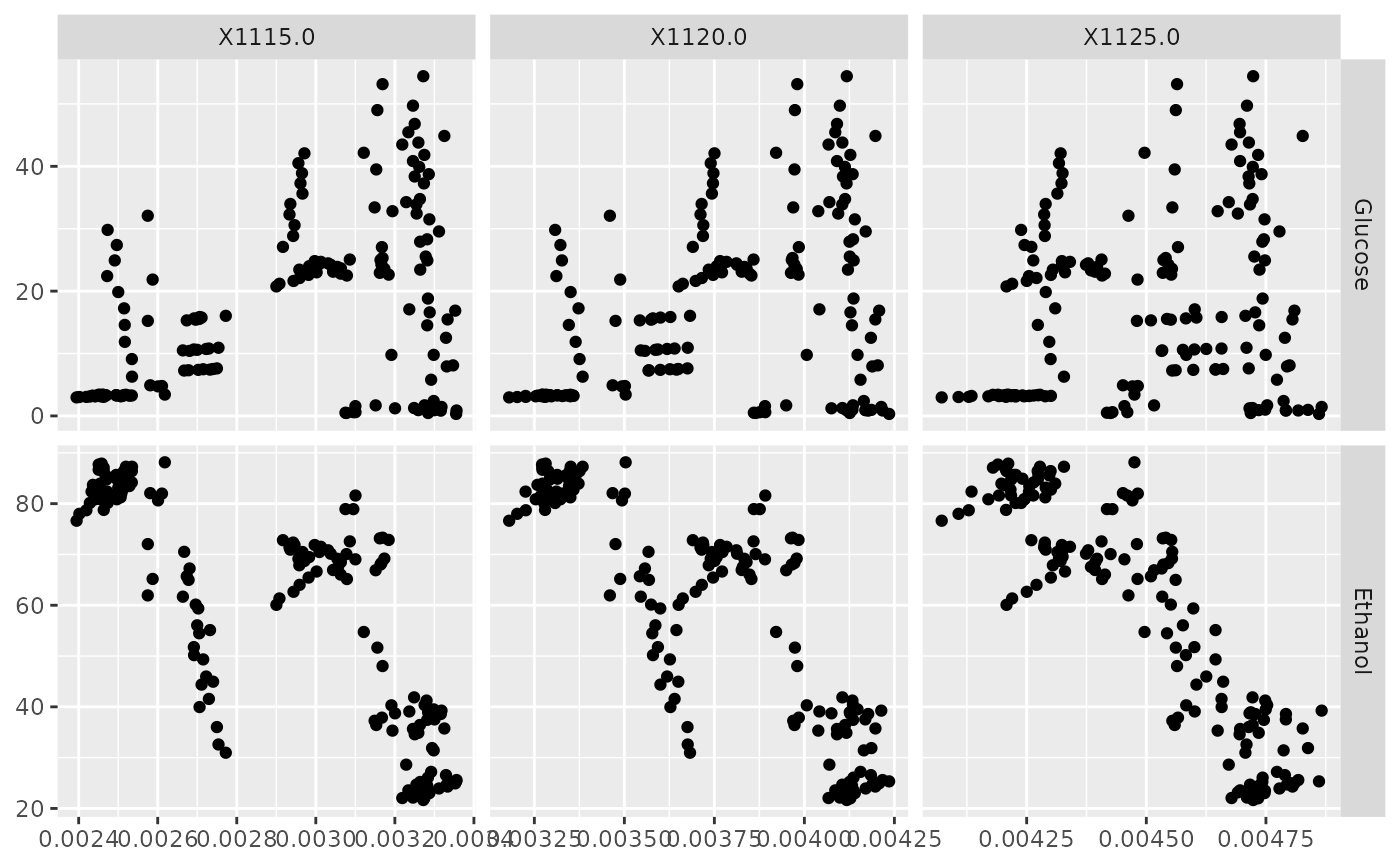
# using ggfacet
p <- ggfacet(NIR_sub, x_cols, y_cols)
p_(p)
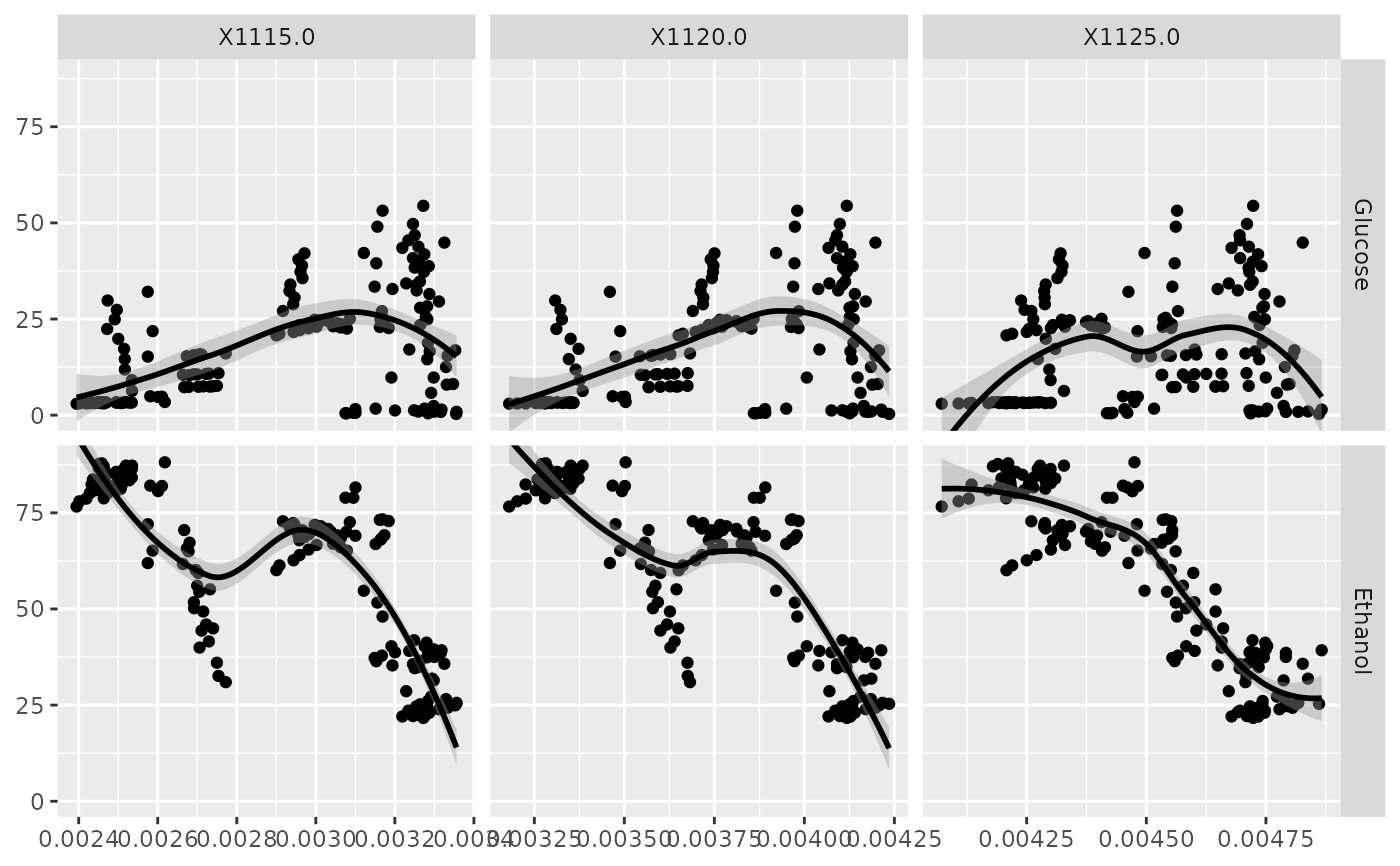
# add a smoother
p <- ggfacet(NIR_sub, x_cols, y_cols, fn = "smooth_loess")
p_(p)
# same output
p <- ggfacet(NIR_sub, x_cols, y_cols, fn = ggally_smooth_loess)
p_(p)
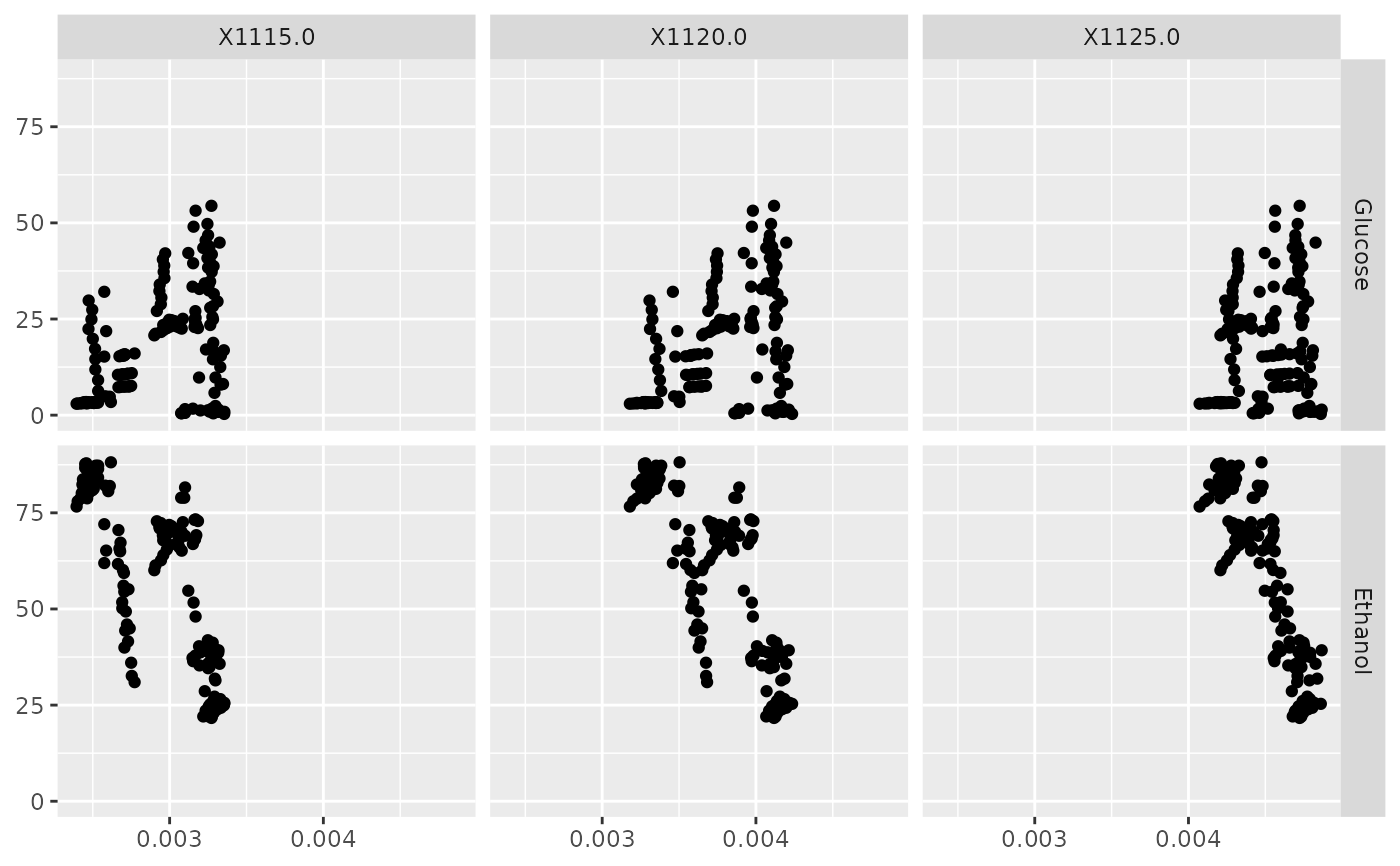
# Change scales to be the same in for every row and for every column
p <- ggfacet(NIR_sub, x_cols, y_cols, scales = "fixed")
p_(p)
}
#> 'data.frame': 166 obs. of 5 variables:
#> $ Glucose: num 9.78 17.08 27.05 33.41 39.5 ...
#> $ Ethanol: num 40.3 39.1 37.9 37.3 36.4 ...
#> $ X1115.0: num 0.00319 0.00324 0.00317 0.00315 0.00315 ...
#> $ X1120.0: num 0.00401 0.00404 0.00398 0.00397 0.00397 ...
#> $ X1125.0: num 0.00458 0.0046 0.00457 0.00455 0.00456 ...